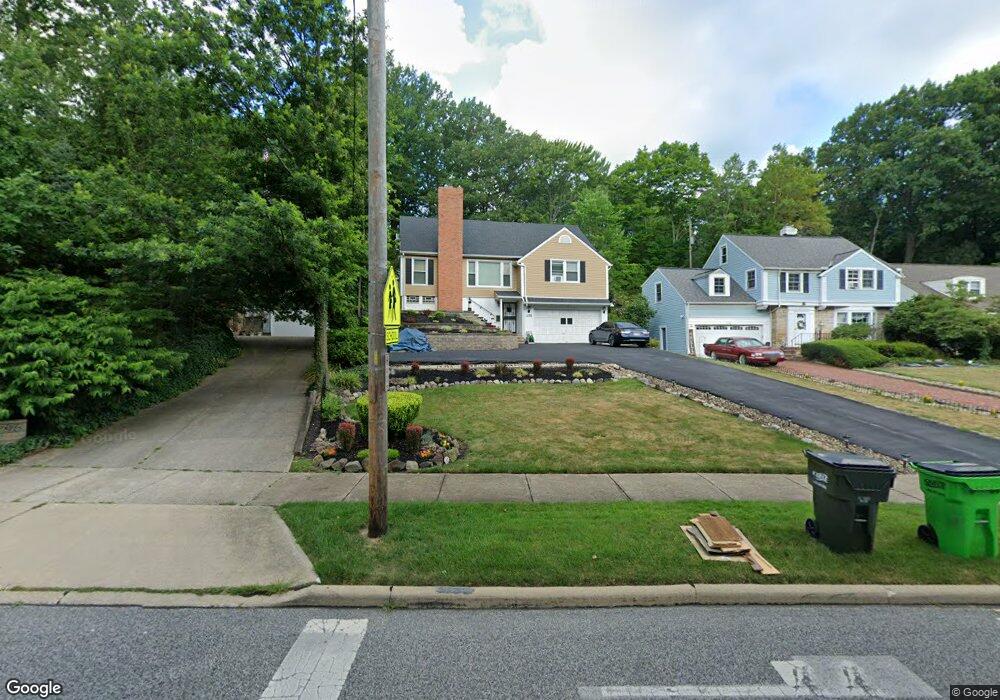
1788 S Belvoir Blvd Cleveland, OH 44121
Estimated Value: $239,761 - $279,000
3
Beds
2
Baths
2,728
Sq Ft
$93/Sq Ft
Est. Value
About This Home
This home is located at 1788 S Belvoir Blvd, Cleveland, OH 44121 and is currently estimated at $253,440, approximately $92 per square foot. 1788 S Belvoir Blvd is a home located in Cuyahoga County with nearby schools including Rowland Elementary School, Greenview Upper Elementary School, and Memorial Junior High School.
Ownership History
Date
Name
Owned For
Owner Type
Purchase Details
Closed on
Aug 16, 2024
Sold by
Gonzalez Christopher J and Gonzalez Catherine
Bought by
Thomas Freddie L
Current Estimated Value
Purchase Details
Closed on
Feb 13, 2004
Sold by
Helstein Martin
Bought by
Gonzalez Christopher J and Gonzalez Catherine
Home Financials for this Owner
Home Financials are based on the most recent Mortgage that was taken out on this home.
Original Mortgage
$218,000
Interest Rate
5.74%
Mortgage Type
VA
Purchase Details
Closed on
Feb 23, 2001
Sold by
Christian Charles H
Bought by
Helstein Martin
Purchase Details
Closed on
Apr 14, 1986
Sold by
Moldovansky Anatoly
Bought by
Moldovansi Anatoly and Moldovansi Sophia
Purchase Details
Closed on
Apr 3, 1981
Sold by
Donnelly Edward P and Donnelly Marcia W
Bought by
Donnelly Kevin P
Purchase Details
Closed on
Jan 1, 1975
Bought by
Donnelly Edward P and Donnelly Marcia W
Create a Home Valuation Report for This Property
The Home Valuation Report is an in-depth analysis detailing your home's value as well as a comparison with similar homes in the area
Home Values in the Area
Average Home Value in this Area
Purchase History
| Date | Buyer | Sale Price | Title Company |
|---|---|---|---|
| Thomas Freddie L | $147,847 | First American Title | |
| Gonzalez Christopher J | $218,000 | Executive Title Agency | |
| Helstein Martin | $126,000 | -- | |
| Moldovansi Anatoly | -- | -- | |
| Moldovansky Anatoly | -- | -- | |
| Donnelly Kevin P | -- | -- | |
| Donnelly Edward P | -- | -- |
Source: Public Records
Mortgage History
| Date | Status | Borrower | Loan Amount |
|---|---|---|---|
| Previous Owner | Gonzalez Christopher J | $218,000 |
Source: Public Records
Tax History Compared to Growth
Tax History
| Year | Tax Paid | Tax Assessment Tax Assessment Total Assessment is a certain percentage of the fair market value that is determined by local assessors to be the total taxable value of land and additions on the property. | Land | Improvement |
|---|---|---|---|---|
| 2024 | $6,344 | $82,915 | $14,245 | $68,670 |
| 2023 | $5,563 | $58,390 | $12,990 | $45,400 |
| 2022 | $5,533 | $58,380 | $12,985 | $45,395 |
| 2021 | $5,493 | $58,380 | $12,990 | $45,400 |
| 2020 | $5,422 | $50,330 | $11,200 | $39,130 |
| 2019 | $4,951 | $159,800 | $32,000 | $127,800 |
| 2018 | $5,445 | $55,930 | $11,200 | $44,730 |
| 2017 | $5,187 | $48,720 | $10,850 | $37,870 |
| 2016 | $5,154 | $48,720 | $10,850 | $37,870 |
| 2015 | $4,998 | $48,720 | $10,850 | $37,870 |
| 2014 | $4,998 | $48,720 | $10,850 | $37,870 |
Source: Public Records
Map
Nearby Homes
- 4233 Bayard Rd
- 1895 Temblethurst Rd
- 1744 S Green Rd
- 1940 Temblethurst Rd
- 4201 Lambert Rd
- 4210 Stonehaven Rd
- 4237 Verona Rd
- 4154 Bexley Blvd
- 1605 Laclede Rd
- 4194 Stilmore Rd
- 1606 Laclede Rd
- 4121 Hinsdale Rd
- 4124 Bayard Rd
- 4206 Verona Rd
- 1834 Maywood Rd
- 1884 Maywood Rd
- 1539 Sheffield Rd
- 1827 Maywood Rd
- 2015 S Green Rd
- 4158 Wyncote Rd
- 1796 S Belvoir Blvd
- 1780 S Belvoir Blvd
- 1800 S Belvoir Blvd
- 1776 S Belvoir Blvd
- 1806 S Belvoir Blvd
- 1768 S Belvoir Blvd
- 1783 Beaconwood Ave
- 1787 Beaconwood Ave
- 1779 Beaconwood Ave
- 1810 S Belvoir Blvd
- 1791 Beaconwood Ave
- 1771 Beaconwood Ave
- 1767 Beaconwood Ave
- 1760 S Belvoir Blvd
- 1795 Beaconwood Ave
- 1816 S Belvoir Blvd
- 1763 Beaconwood Ave
- 1795 S Belvoir Blvd
- 1799 S Belvoir Blvd
- 1801 Beaconwood Ave