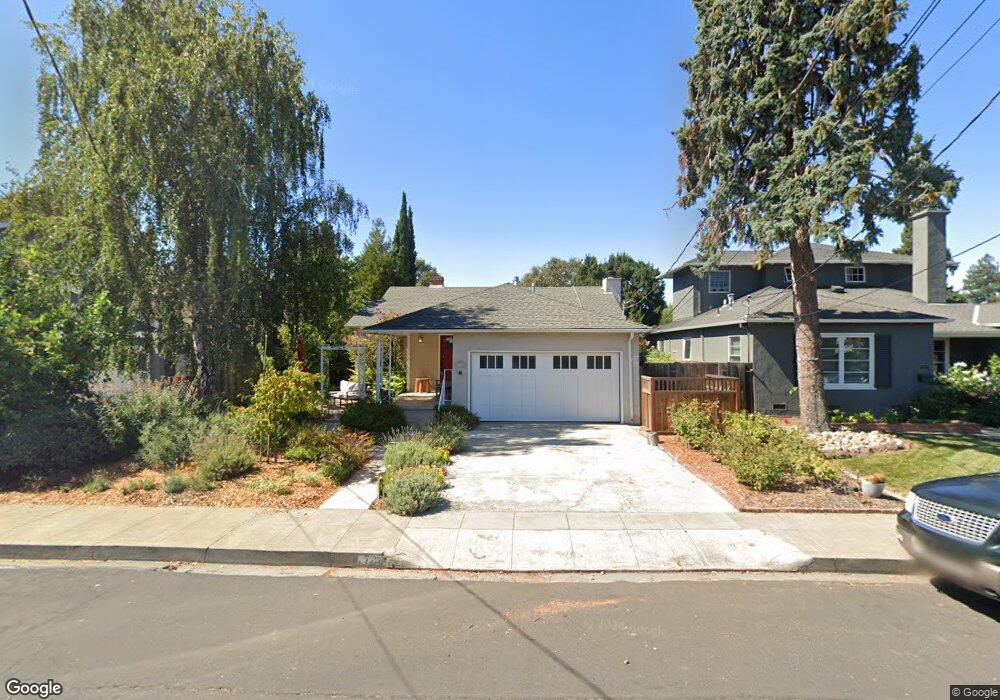
1788 Walnut St San Carlos, CA 94070
El Sereno Corte NeighborhoodEstimated Value: $2,219,000 - $2,650,000
3
Beds
2
Baths
1,810
Sq Ft
$1,371/Sq Ft
Est. Value
About This Home
This home is located at 1788 Walnut St, San Carlos, CA 94070 and is currently estimated at $2,481,366, approximately $1,370 per square foot. 1788 Walnut St is a home located in San Mateo County with nearby schools including White Oaks Elementary School, Central Middle School, and Sequoia High School.
Ownership History
Date
Name
Owned For
Owner Type
Purchase Details
Closed on
May 28, 2004
Sold by
Jacobson Patricia M and Jacobson David J
Bought by
Jacobson Patricia M and Jacobson David J
Current Estimated Value
Purchase Details
Closed on
Apr 26, 1996
Sold by
Deer Andrew C and Deer Lisa M
Bought by
Jacobson David J and Jacobson Patricia M
Home Financials for this Owner
Home Financials are based on the most recent Mortgage that was taken out on this home.
Original Mortgage
$295,000
Outstanding Balance
$13,980
Interest Rate
6.1%
Estimated Equity
$2,467,386
Purchase Details
Closed on
Jan 28, 1995
Sold by
Blote Palmer L and Blote Irene D
Bought by
Deer Andrew C and Deer Lisa M
Home Financials for this Owner
Home Financials are based on the most recent Mortgage that was taken out on this home.
Original Mortgage
$320,000
Interest Rate
9.2%
Create a Home Valuation Report for This Property
The Home Valuation Report is an in-depth analysis detailing your home's value as well as a comparison with similar homes in the area
Home Values in the Area
Average Home Value in this Area
Purchase History
| Date | Buyer | Sale Price | Title Company |
|---|---|---|---|
| Jacobson Patricia M | -- | -- | |
| Jacobson David J | $405,000 | Old Republic Title Company | |
| Deer Andrew C | $400,000 | North American Title Insuran |
Source: Public Records
Mortgage History
| Date | Status | Borrower | Loan Amount |
|---|---|---|---|
| Open | Jacobson David J | $295,000 | |
| Previous Owner | Deer Andrew C | $320,000 | |
| Closed | Deer Andrew C | $60,000 |
Source: Public Records
Tax History
| Year | Tax Paid | Tax Assessment Tax Assessment Total Assessment is a certain percentage of the fair market value that is determined by local assessors to be the total taxable value of land and additions on the property. | Land | Improvement |
|---|---|---|---|---|
| 2025 | $8,871 | $672,792 | $336,396 | $336,396 |
| 2023 | $8,871 | $646,668 | $323,334 | $323,334 |
| 2022 | $8,689 | $633,990 | $316,995 | $316,995 |
| 2021 | $8,550 | $621,560 | $310,780 | $310,780 |
| 2020 | $8,439 | $615,188 | $307,594 | $307,594 |
| 2019 | $8,240 | $603,126 | $301,563 | $301,563 |
| 2018 | $8,017 | $591,300 | $295,650 | $295,650 |
| 2017 | $7,896 | $579,706 | $289,853 | $289,853 |
| 2016 | $7,715 | $568,340 | $284,170 | $284,170 |
| 2015 | $7,689 | $559,804 | $279,902 | $279,902 |
| 2014 | $7,416 | $548,840 | $274,420 | $274,420 |
Source: Public Records
Map
Nearby Homes
- 38 Liberty Hall Ln
- 6 El Sereno Dr
- 24 Avondale Ave
- 111 Wellesley Crescent Unit 2N
- 167 F St
- 1385 Elm St
- 55 Claremont Ave Unit 301
- 219 D St
- 1140 Whipple Ave Unit 22
- 1440 Howard Ave
- 2044 Saint Francis Way
- 1180 Rosewood Ave
- 1928 Howard Ave
- 921 Arlington Rd
- 1001 Laurel St Unit 316
- 987 Laurel St
- 2349 Eaton Ave
- 27 Nevada St
- 967 Orange Ave
- 926 Rosewood Ave
Your Personal Tour Guide
Ask me questions while you tour the home.