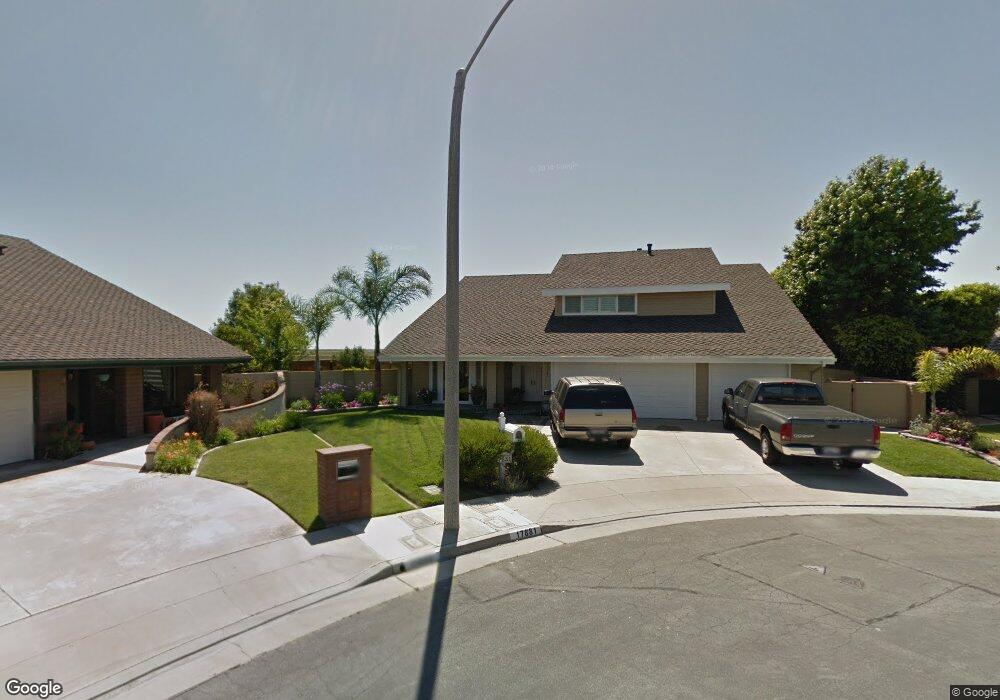
17881 Felson Cir Huntington Beach, CA 92649
Estimated Value: $1,746,309 - $2,065,000
4
Beds
4
Baths
2,518
Sq Ft
$758/Sq Ft
Est. Value
About This Home
This home is located at 17881 Felson Cir, Huntington Beach, CA 92649 and is currently estimated at $1,909,827, approximately $758 per square foot. 17881 Felson Cir is a home located in Orange County with nearby schools including Hope View Elementary School, Marine View Middle, and Huntington Beach High School.
Ownership History
Date
Name
Owned For
Owner Type
Purchase Details
Closed on
Mar 11, 2019
Sold by
Peterson Sherry
Bought by
Peterson Linn Brandt and Peterson Sherry A
Current Estimated Value
Home Financials for this Owner
Home Financials are based on the most recent Mortgage that was taken out on this home.
Original Mortgage
$726,525
Interest Rate
4.4%
Mortgage Type
New Conventional
Purchase Details
Closed on
Oct 16, 2006
Sold by
Peterson L Brandt
Bought by
Peterson Sherry
Home Financials for this Owner
Home Financials are based on the most recent Mortgage that was taken out on this home.
Original Mortgage
$728,000
Interest Rate
8.37%
Mortgage Type
Negative Amortization
Purchase Details
Closed on
Jun 24, 1999
Sold by
Brandt Peterson L
Bought by
Peterson Brandt and Peterson Sherry
Home Financials for this Owner
Home Financials are based on the most recent Mortgage that was taken out on this home.
Original Mortgage
$240,000
Interest Rate
7.2%
Create a Home Valuation Report for This Property
The Home Valuation Report is an in-depth analysis detailing your home's value as well as a comparison with similar homes in the area
Home Values in the Area
Average Home Value in this Area
Purchase History
| Date | Buyer | Sale Price | Title Company |
|---|---|---|---|
| Peterson Linn Brandt | -- | Consumers Title Company | |
| Peterson Sherry | -- | United Title | |
| Peterson Brandt | -- | Orange Coast Title |
Source: Public Records
Mortgage History
| Date | Status | Borrower | Loan Amount |
|---|---|---|---|
| Closed | Peterson Linn Brandt | $726,525 | |
| Closed | Peterson Sherry | $728,000 | |
| Closed | Peterson Brandt | $240,000 | |
| Closed | Peterson Brandt | $50,000 |
Source: Public Records
Tax History Compared to Growth
Tax History
| Year | Tax Paid | Tax Assessment Tax Assessment Total Assessment is a certain percentage of the fair market value that is determined by local assessors to be the total taxable value of land and additions on the property. | Land | Improvement |
|---|---|---|---|---|
| 2025 | $2,529 | $206,235 | $44,113 | $162,122 |
| 2024 | $2,529 | $202,192 | $43,248 | $158,944 |
| 2023 | $2,468 | $198,228 | $42,400 | $155,828 |
| 2022 | $2,426 | $194,342 | $41,569 | $152,773 |
| 2021 | $2,382 | $190,532 | $40,754 | $149,778 |
| 2020 | $2,355 | $188,579 | $40,336 | $148,243 |
| 2019 | $2,317 | $184,882 | $39,545 | $145,337 |
| 2018 | $2,266 | $181,257 | $38,769 | $142,488 |
| 2017 | $2,229 | $177,703 | $38,008 | $139,695 |
| 2016 | $2,143 | $174,219 | $37,263 | $136,956 |
| 2015 | $2,110 | $171,603 | $36,704 | $134,899 |
| 2014 | $2,067 | $168,242 | $35,985 | $132,257 |
Source: Public Records
Map
Nearby Homes
- 17982 Whitford Ln
- 5812 Raphael Dr
- 5862 Raphael Dr
- 6012 Jasonwood Dr
- 18202 Foss Ln
- 6171 Kiser Dr
- 5262 Glenroy Dr
- 17301 Juniper Ln
- 17202 Corbina Ln Unit 108
- 5241 Glenroy Dr
- 17191 Corbina Ln Unit 110
- 17442 Coronado Ln
- 18321 Fieldbury Ln
- 17472 Oakbluffs Ln
- 17042 Twain Ln
- 5031 202 Dorado
- 4746 Oceanridge Dr
- 6051 Summerdale Dr
- 17291 Wareham Ln
- 17231 Lido Ln
- 17871 Felson Cir
- 17892 Felson Cir
- 17842 Alfawn Cir
- 17851 Felson Cir
- 17882 Felson Cir
- 17852 Alfawn Cir
- 17832 Alfawn Cir
- 17872 Felson Cir
- 17901 Denvale Cir
- 17911 Denvale Cir
- 17831 Alfawn Cir
- 17891 Denvale Cir
- 5541 Selkirk Dr
- 5531 Selkirk Dr
- 5551 Selkirk Dr
- 5521 Selkirk Dr
- 17821 Alfawn Cir
- 5561 Selkirk Dr
- 17921 Denvale Cir
- 5511 Selkirk Dr