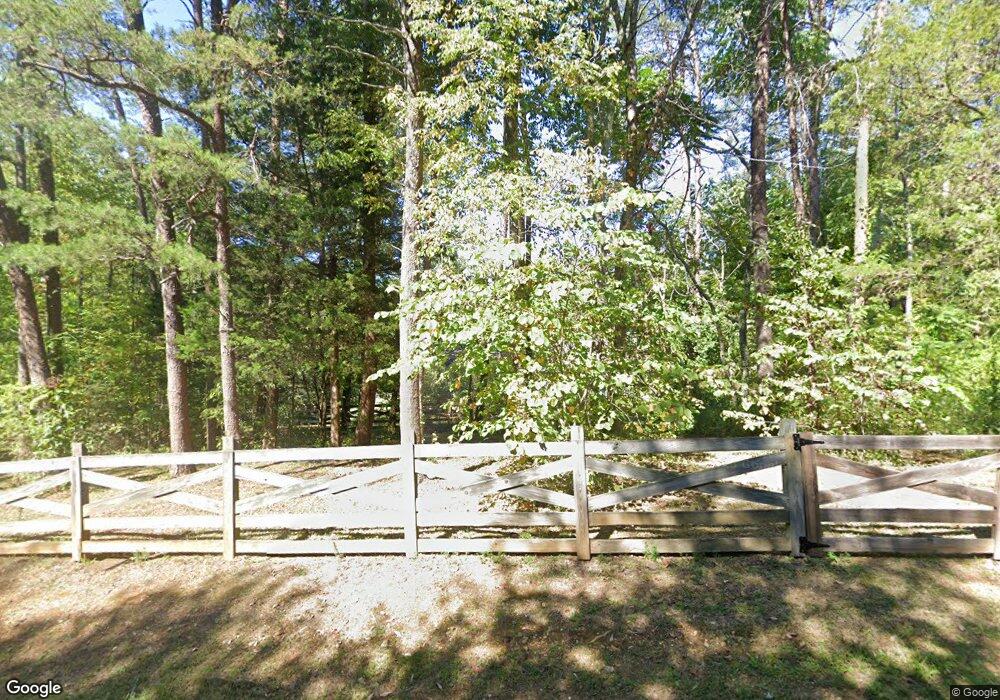
1789 Timber Trail Cookeville, TN 38501
Estimated Value: $439,418 - $666,000
--
Bed
3
Baths
1,904
Sq Ft
$311/Sq Ft
Est. Value
About This Home
This home is located at 1789 Timber Trail, Cookeville, TN 38501 and is currently estimated at $591,355, approximately $310 per square foot. 1789 Timber Trail is a home located in Putnam County with nearby schools including Cookeville High School, Northeast Elementary School, and Algood Middle School.
Ownership History
Date
Name
Owned For
Owner Type
Purchase Details
Closed on
Mar 16, 2005
Sold by
Halderson William A
Bought by
Halderson William A Family Tru
Current Estimated Value
Purchase Details
Closed on
Feb 20, 2004
Sold by
Robert Williams and Robert Barbara
Bought by
Halderson William A and Halderson Monica B
Purchase Details
Closed on
Feb 12, 1998
Sold by
Art Murphy V
Bought by
Ray Barbara J
Purchase Details
Closed on
Jun 4, 1996
Sold by
Art Murphy V
Bought by
Art Murphy V
Purchase Details
Closed on
Sep 20, 1995
Sold by
Robin Ingles
Bought by
Art Murphy V
Purchase Details
Closed on
Apr 30, 1993
Bought by
Ingles Robin
Purchase Details
Closed on
Aug 29, 1990
Bought by
Ingles Jose F and Ingles Robin
Purchase Details
Closed on
Apr 11, 1990
Bought by
Moores Malcolm N and Moores Larry Phillips
Purchase Details
Closed on
Aug 8, 1989
Bought by
Ingles Jose F and Ingles Robin
Purchase Details
Closed on
Jul 5, 1988
Bought by
Citizens Bank & Claudine
Create a Home Valuation Report for This Property
The Home Valuation Report is an in-depth analysis detailing your home's value as well as a comparison with similar homes in the area
Home Values in the Area
Average Home Value in this Area
Purchase History
| Date | Buyer | Sale Price | Title Company |
|---|---|---|---|
| Halderson William A Family Tru | -- | -- | |
| Halderson William A | $242,500 | -- | |
| Ray Barbara J | $190,000 | -- | |
| Art Murphy V | -- | -- | |
| Art Murphy V | $169,000 | -- | |
| Ingles Robin | -- | -- | |
| Ingles Jose F | $71,500 | -- | |
| Moores Malcolm N | -- | -- | |
| Ingles Jose F | -- | -- | |
| Citizens Bank & Claudine | -- | -- |
Source: Public Records
Tax History Compared to Growth
Tax History
| Year | Tax Paid | Tax Assessment Tax Assessment Total Assessment is a certain percentage of the fair market value that is determined by local assessors to be the total taxable value of land and additions on the property. | Land | Improvement |
|---|---|---|---|---|
| 2024 | $2,224 | $83,625 | $13,025 | $70,600 |
| 2023 | $2,224 | $83,625 | $13,025 | $70,600 |
| 2022 | $2,067 | $83,625 | $13,025 | $70,600 |
| 2021 | $2,067 | $83,625 | $13,025 | $70,600 |
| 2020 | $1,753 | $83,625 | $13,025 | $70,600 |
| 2019 | $1,753 | $59,925 | $11,325 | $48,600 |
| 2018 | $1,636 | $59,925 | $11,325 | $48,600 |
| 2017 | $1,636 | $59,925 | $11,325 | $48,600 |
| 2016 | $1,636 | $59,925 | $11,325 | $48,600 |
| 2015 | $1,681 | $59,925 | $11,325 | $48,600 |
| 2014 | $1,739 | $61,988 | $0 | $0 |
Source: Public Records
Map
Nearby Homes
- 1748 Timber Trail
- 1704 Timber Trail
- 7030 Dodson Branch Rd
- 2220 SE Crag Rock
- 6950 Dodson Branch Rd
- 0 John Garrison Rd
- 7 AC John Garrison Rd
- 1737 Cummins Mill Rd
- 5900 Dodson Branch Rd
- 343 Mabry School Rd
- 4.62 AC Cummins Mill Rd
- 6180 Bob Lynn Rd
- 7031 S Smith Chapel Rd
- 7630 Walking Horse Ln
- 5546 Emerald Rd
- 4882 Emerald Rd
- 5585 Emerald Rd
- 1784 Timber Trail
- 1788 Timber Trail
- 1794 Timber Trail
- 1780 Timber Trail
- 1776 Timber Trail
- 1758 Dry Creek Rd
- 1772 Timber Trail
- 1800 Timber Trail
- 1752 Dry Creek Rd
- 1763 Timber Trail
- 1751 Dry Creek Rd
- 1756 Timber Trail
- 1823 Timber Trail
- 1746 Dry Creek Rd
- 1812 Timber Trail
- 146 Owen Farm Ln
- 3.5 Ac Timber Trail
- 6 ac Timber Trail
- 7.39 Ac Timber Trail
- 7 AC Timber Trail