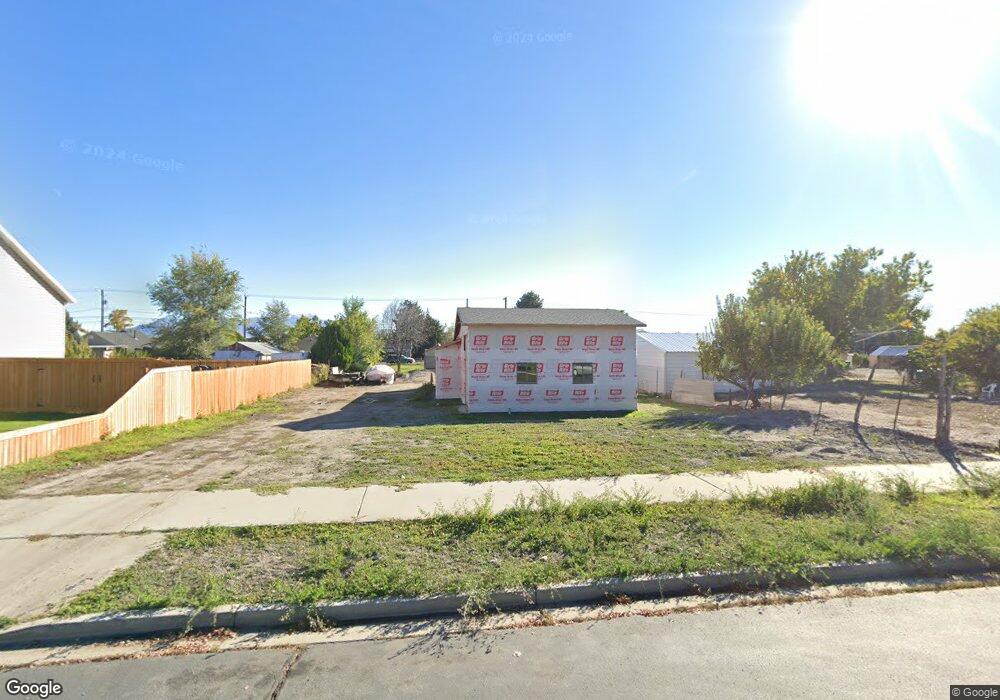
1789 W 520 S Unit 3 Provo, UT 84601
Franklin NeighborhoodEstimated Value: $248,494
--
Bed
--
Bath
1,408
Sq Ft
$176/Sq Ft
Est. Value
About This Home
This home is located at 1789 W 520 S Unit 3, Provo, UT 84601 and is currently estimated at $248,494, approximately $176 per square foot. 1789 W 520 S Unit 3 is a home located in Utah County with nearby schools including Sunset View Elementary School, Dixon Middle School, and Provo High School.
Ownership History
Date
Name
Owned For
Owner Type
Purchase Details
Closed on
Jan 15, 2025
Sold by
Estrada Jose Isreal
Bought by
Eba Holdings Llc
Current Estimated Value
Home Financials for this Owner
Home Financials are based on the most recent Mortgage that was taken out on this home.
Original Mortgage
$141,775
Outstanding Balance
$140,767
Interest Rate
6.69%
Mortgage Type
New Conventional
Estimated Equity
$107,727
Purchase Details
Closed on
Apr 21, 2022
Sold by
Provo Land Exchange Xix Llc
Bought by
Willemin Trent
Purchase Details
Closed on
Nov 30, 2021
Sold by
Towne & Country Investments Llc
Bought by
Provo Land Exchange Xix Llc
Purchase Details
Closed on
Oct 25, 2012
Sold by
Catt Ruth B
Bought by
Towne & Country Investments Llc
Purchase Details
Closed on
Jun 14, 2011
Sold by
Carter Shon Lee
Bought by
Catt Ruth B
Create a Home Valuation Report for This Property
The Home Valuation Report is an in-depth analysis detailing your home's value as well as a comparison with similar homes in the area
Home Values in the Area
Average Home Value in this Area
Purchase History
| Date | Buyer | Sale Price | Title Company |
|---|---|---|---|
| Eba Holdings Llc | -- | Real Advantage Title | |
| Eba Holdings Llc | -- | Real Advantage Title | |
| Willemin Trent | -- | None Listed On Document | |
| Provo Land Exchange Xix Llc | -- | Provo Land Title | |
| Towne & Country Investments Llc | -- | First American Title Company | |
| Catt Ruth B | -- | None Available |
Source: Public Records
Mortgage History
| Date | Status | Borrower | Loan Amount |
|---|---|---|---|
| Open | Eba Holdings Llc | $141,775 | |
| Closed | Eba Holdings Llc | $141,775 |
Source: Public Records
Tax History Compared to Growth
Tax History
| Year | Tax Paid | Tax Assessment Tax Assessment Total Assessment is a certain percentage of the fair market value that is determined by local assessors to be the total taxable value of land and additions on the property. | Land | Improvement |
|---|---|---|---|---|
| 2025 | $2,174 | $224,600 | $221,600 | $3,000 |
| 2024 | $2,174 | $214,000 | $0 | $0 |
| 2023 | $2,205 | $214,000 | $0 | $0 |
| 2022 | $1,282 | $125,400 | $0 | $0 |
| 2021 | $748 | $127,700 | $125,000 | $2,700 |
| 2020 | $696 | $111,400 | $108,700 | $2,700 |
| 2019 | $670 | $111,400 | $108,700 | $2,700 |
| 2018 | $597 | $100,800 | $98,100 | $2,700 |
| 2017 | $556 | $51,590 | $0 | $0 |
| 2016 | $1,137 | $98,300 | $0 | $0 |
| 2015 | $1,005 | $87,800 | $0 | $0 |
| 2014 | $1,063 | $96,800 | $0 | $0 |
Source: Public Records
Map
Nearby Homes
- 1972 W 600 S
- 655 S 1600 W
- 312 S 1920 W
- 2012 W 350 S
- 147 S 1680 W
- 2275 W 600 S
- 1303 W 600 S
- 265 S 2370 W
- 1240 W 890 S
- 1704 W 50 N
- 1125 Lakeview Pkwy
- 1075 Lakeview Pkwy
- 1744 W 150 N
- 47 N 2250 W
- 974 W 600 S Unit 1
- 255 N 1600 W Unit 52
- 255 N 1600 W Unit 148
- 255 N 1600 W Unit 81
- 259 S 1050 W Unit 76
- 221 S 1050 W Unit 35