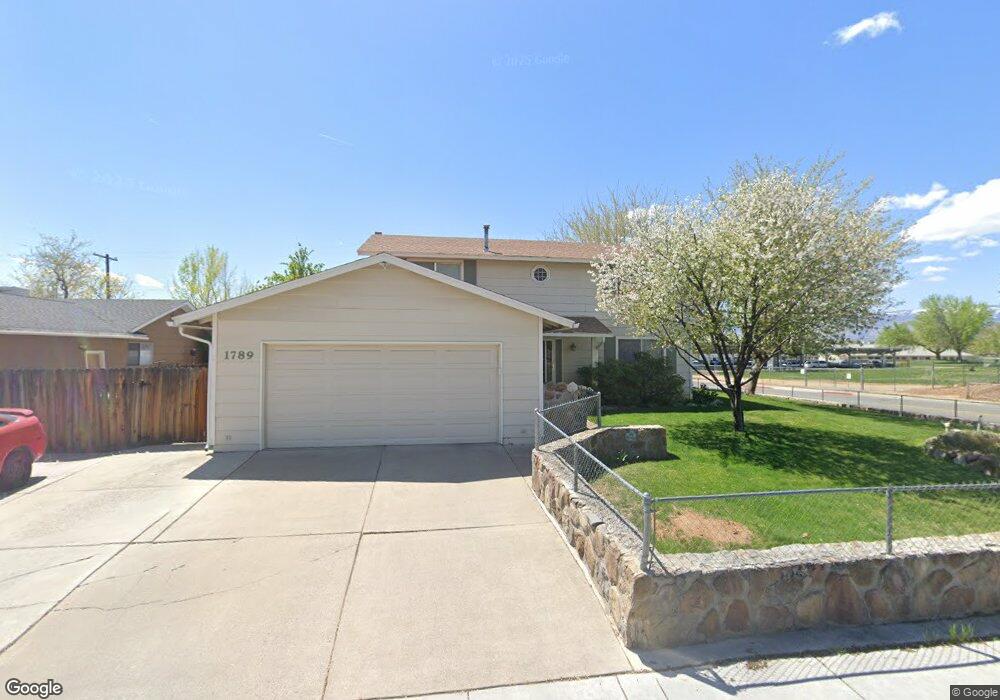
1789 Zephyr Way Sparks, NV 89431
North Rock NeighborhoodEstimated Value: $502,000 - $601,000
4
Beds
3
Baths
2,128
Sq Ft
$254/Sq Ft
Est. Value
About This Home
This home is located at 1789 Zephyr Way, Sparks, NV 89431 and is currently estimated at $541,068, approximately $254 per square foot. 1789 Zephyr Way is a home located in Washoe County with nearby schools including Alice Maxwell Elementary School, Sparks Middle School, and Sparks High School.
Ownership History
Date
Name
Owned For
Owner Type
Purchase Details
Closed on
Feb 4, 2006
Sold by
Ashley Richard D and Ashley Marianna G
Bought by
Ashley Richard D and Ashley Marianna G
Current Estimated Value
Home Financials for this Owner
Home Financials are based on the most recent Mortgage that was taken out on this home.
Original Mortgage
$232,000
Outstanding Balance
$133,375
Interest Rate
6.56%
Mortgage Type
New Conventional
Estimated Equity
$407,693
Purchase Details
Closed on
Dec 27, 2002
Sold by
Zalot Teresa
Bought by
Zalot Zygmunt
Home Financials for this Owner
Home Financials are based on the most recent Mortgage that was taken out on this home.
Original Mortgage
$168,000
Interest Rate
5.96%
Purchase Details
Closed on
Aug 30, 1999
Sold by
Valdez Bruno
Bought by
Zalot Zygmunt and Zalot Teresa
Home Financials for this Owner
Home Financials are based on the most recent Mortgage that was taken out on this home.
Original Mortgage
$100,000
Interest Rate
7.37%
Purchase Details
Closed on
Feb 20, 1996
Sold by
Valdez Bruno
Bought by
Valdez Bruno
Create a Home Valuation Report for This Property
The Home Valuation Report is an in-depth analysis detailing your home's value as well as a comparison with similar homes in the area
Home Values in the Area
Average Home Value in this Area
Purchase History
| Date | Buyer | Sale Price | Title Company |
|---|---|---|---|
| Ashley Richard D | -- | First American | |
| Zalot Zygmunt | -- | First Centennial Title Co | |
| Zalot Zygmunt | $155,000 | First American Title | |
| Valdez Bruno | -- | -- |
Source: Public Records
Mortgage History
| Date | Status | Borrower | Loan Amount |
|---|---|---|---|
| Open | Ashley Richard D | $232,000 | |
| Closed | Zalot Zygmunt | $168,000 | |
| Closed | Zalot Zygmunt | $100,000 |
Source: Public Records
Tax History Compared to Growth
Tax History
| Year | Tax Paid | Tax Assessment Tax Assessment Total Assessment is a certain percentage of the fair market value that is determined by local assessors to be the total taxable value of land and additions on the property. | Land | Improvement |
|---|---|---|---|---|
| 2025 | $1,665 | $66,414 | $34,825 | $31,589 |
| 2024 | $1,665 | $61,361 | $30,205 | $31,156 |
| 2023 | $1,620 | $60,589 | $31,780 | $28,809 |
| 2022 | $1,573 | $52,056 | $27,160 | $24,896 |
| 2021 | $1,528 | $43,855 | $18,235 | $25,620 |
| 2020 | $1,482 | $44,346 | $17,850 | $26,496 |
| 2019 | $1,440 | $44,492 | $17,605 | $26,887 |
| 2018 | $1,397 | $39,433 | $12,355 | $27,078 |
| 2017 | $1,357 | $39,166 | $11,235 | $27,931 |
| 2016 | $1,324 | $38,821 | $9,765 | $29,056 |
| 2015 | $1,323 | $38,365 | $8,645 | $29,720 |
| 2014 | $1,262 | $34,682 | $6,335 | $28,347 |
| 2013 | -- | $33,538 | $4,900 | $28,638 |
Source: Public Records
Map
Nearby Homes
- 1731 Gault Way Unit D
- 1799 Vance Way
- 1595 York Way
- 1620 Gault Way
- 2154 Oppio St
- 1655 Byrd Dr
- 1345 Plymouth Way
- 0 N Mccarran Blvd Unit 250052909
- 1780 Greenbrae Dr
- 1160 York Way
- 1125 Dodson Way
- 1110 Xman Way
- 1855 Verano Dr
- 3116 Sterling Ridge Cir
- 1124 Sbragia Way
- 1365 Prospect Ave
- 3269 Valley Forge Way
- 3230 Creekside Ln Unit 1
- 1121 Greenbrae Dr
- 1889 Merchant St
- 1777 Zephyr Way
- 2408 18th St
- 1782 York Way
- 1817 Zephyr Way
- 1769 Zephyr Way
- 2530 18th St
- 1770 York Way
- 2509 18th St
- 1774 Zephyr Way
- 1755 Zephyr Way
- 1760 York Way Unit 4
- 1760 York Way
- 1826 Zephyr Way
- 1766 Zephyr Way
- 1843 Zephyr Way
- 1797 York Way
- 1799 York Way
- 2539 18th St
- 1787 Plymouth Way
- 1795 York Way