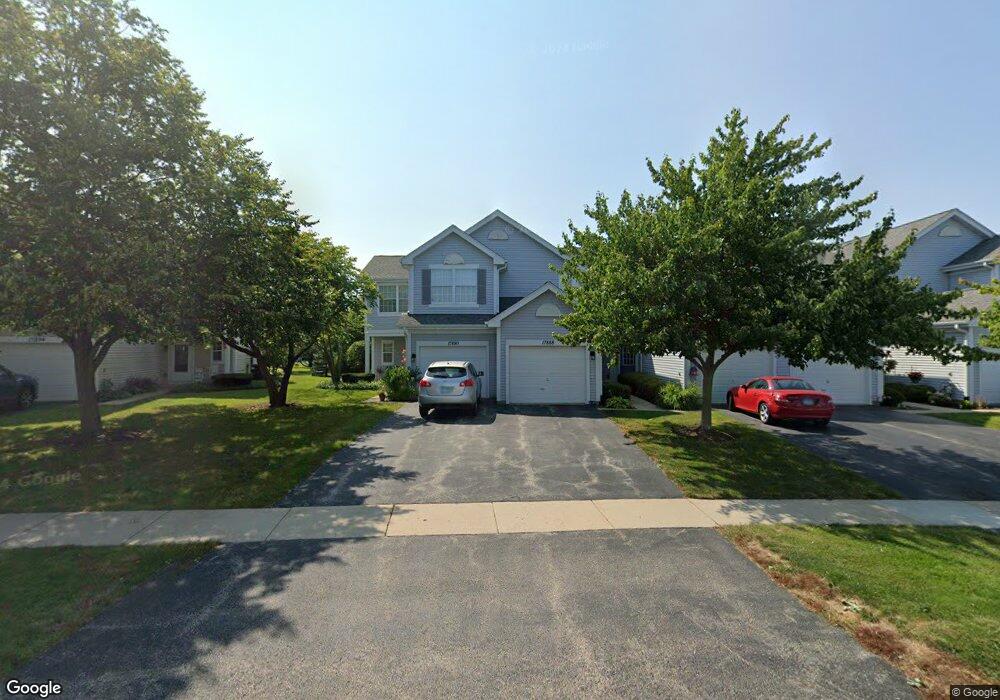
17890 W Braewick Rd Gurnee, IL 60031
Estimated Value: $254,000 - $268,107
2
Beds
3
Baths
1,430
Sq Ft
$184/Sq Ft
Est. Value
About This Home
This home is located at 17890 W Braewick Rd, Gurnee, IL 60031 and is currently estimated at $263,777, approximately $184 per square foot. 17890 W Braewick Rd is a home located in Lake County with nearby schools including Woodland Primary School, Woodland Intermediate School, and Woodland Elementary School.
Ownership History
Date
Name
Owned For
Owner Type
Purchase Details
Closed on
Sep 30, 2002
Sold by
Varsek Chris
Bought by
Hofung Dawn
Current Estimated Value
Purchase Details
Closed on
Feb 15, 2001
Sold by
Larson Daniel C
Bought by
Varsek Chris
Home Financials for this Owner
Home Financials are based on the most recent Mortgage that was taken out on this home.
Original Mortgage
$127,700
Interest Rate
7.06%
Purchase Details
Closed on
Sep 1, 1995
Sold by
Trock Scott N and Trock Karen M
Bought by
Larson Daniel C
Home Financials for this Owner
Home Financials are based on the most recent Mortgage that was taken out on this home.
Original Mortgage
$117,900
Interest Rate
8%
Purchase Details
Closed on
Dec 1, 1993
Sold by
Harris Bank Hinsdale
Bought by
Trock Scott N and Trock Karen M
Home Financials for this Owner
Home Financials are based on the most recent Mortgage that was taken out on this home.
Original Mortgage
$98,000
Interest Rate
7.16%
Create a Home Valuation Report for This Property
The Home Valuation Report is an in-depth analysis detailing your home's value as well as a comparison with similar homes in the area
Home Values in the Area
Average Home Value in this Area
Purchase History
| Date | Buyer | Sale Price | Title Company |
|---|---|---|---|
| Hofung Dawn | $167,000 | -- | |
| Varsek Chris | $142,000 | Chicago Title Insurance Co | |
| Larson Daniel C | $131,000 | -- | |
| Trock Scott N | $82,000 | Chicago Title Insurance Co |
Source: Public Records
Mortgage History
| Date | Status | Borrower | Loan Amount |
|---|---|---|---|
| Previous Owner | Varsek Chris | $127,700 | |
| Previous Owner | Larson Daniel C | $117,900 | |
| Previous Owner | Trock Scott N | $98,000 |
Source: Public Records
Tax History Compared to Growth
Tax History
| Year | Tax Paid | Tax Assessment Tax Assessment Total Assessment is a certain percentage of the fair market value that is determined by local assessors to be the total taxable value of land and additions on the property. | Land | Improvement |
|---|---|---|---|---|
| 2024 | $4,554 | $69,766 | $9,679 | $60,087 |
| 2023 | $4,549 | $62,885 | $8,724 | $54,161 |
| 2022 | $4,549 | $55,437 | $7,659 | $47,778 |
| 2021 | $2,413 | $51,663 | $7,138 | $44,525 |
| 2020 | $2,387 | $50,394 | $6,963 | $43,431 |
| 2019 | $2,383 | $48,931 | $6,761 | $42,170 |
| 2018 | $2,390 | $46,968 | $5,472 | $41,496 |
| 2017 | $2,450 | $45,622 | $5,315 | $40,307 |
| 2016 | $2,543 | $43,590 | $5,078 | $38,512 |
| 2015 | $2,607 | $41,341 | $4,816 | $36,525 |
| 2014 | $2,515 | $35,853 | $4,751 | $31,102 |
| 2012 | $3,143 | $40,401 | $4,787 | $35,614 |
Source: Public Records
Map
Nearby Homes
- 36077 N Bridlewood Ave
- 17876 W Braewick Rd
- 17775 W Braewick Rd
- 17820 W Braewick Rd
- 17781 W Elsbury St
- 36259 N Field View Dr
- 1601 Newgate Ct
- 18229 W Banbury Dr
- 36217 N Old Creek Ct
- 18325 W Lakeview Terrace
- 1603 Napa Dr
- 1593 Vineyard Dr
- 6797 Roanoake Ct
- 7623 Beringer Ct
- 6877 W Mount Vernon Ct Unit 4A
- 6771 E Wellsley Ct
- 36712 N Traer Terrace
- 17925 W Stearns School Rd
- 18705 W Ash Dr
- 18758 W Highfield Dr
- 17886 W Braewick Rd
- 17884 W Braewick Rd
- 17894 W Braewick Rd
- 17896 W Braewick Rd
- 17898 W Braewick Rd
- 17900 W Braewick Rd Unit 2
- 17900 W Braewick Rd
- 17880 W Braewick Rd
- 17882 W Braewick Rd
- 17882 W Braewick Rd
- 17902 W Braewick Rd
- 17876 W Braewick Rd Unit 1
- 17904 W Braewick Rd
- 17872 W Braewick Rd
- 17906 W Braewick Rd
- 36093 N Bridlewood Ave
- 17908 W Braewick Rd
- 17893 W Braewick Rd
- 17895 W Braewick Rd
- 17891 W Braewick Rd