Estimated Value: $571,000 - $671,000
3
Beds
3
Baths
1,259
Sq Ft
$502/Sq Ft
Est. Value
About This Home
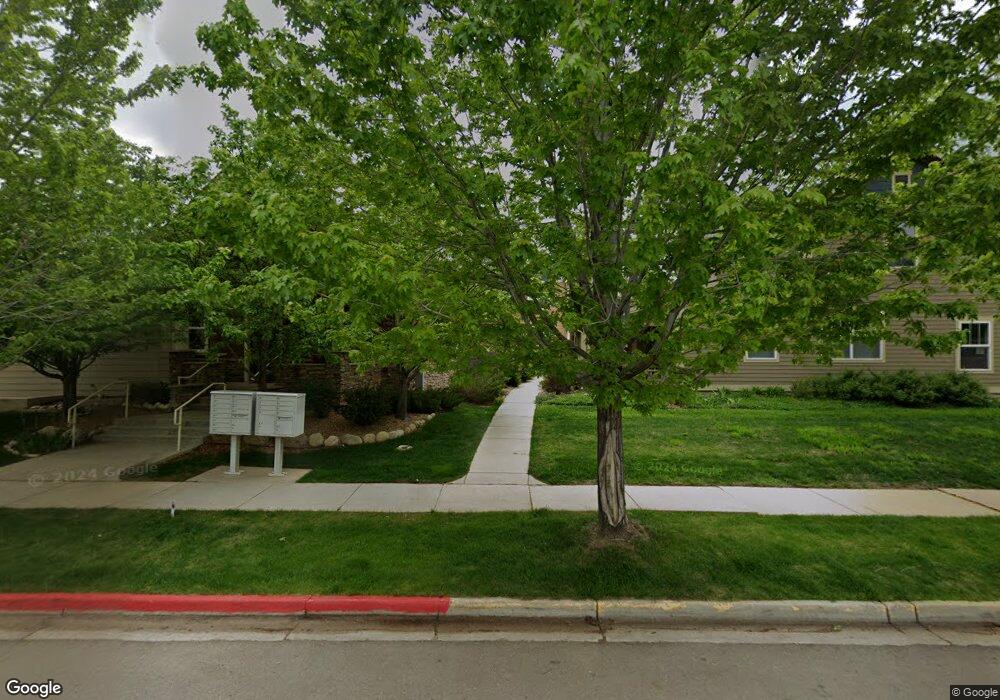
This home is located at 179 2nd Ave Unit 5B, Lyons, CO 80540 and is currently estimated at $632,601, approximately $502 per square foot. 179 2nd Ave Unit 5B is a home located in Boulder County with nearby schools including Lyons Elementary School and Lyons Middle/Senior High School.
Ownership History
Date
Name
Owned For
Owner Type
Purchase Details
Closed on
Apr 21, 2025
Sold by
Odendahl Teresa Jean
Bought by
Lippa Drew Murray
Current Estimated Value
Purchase Details
Closed on
Mar 21, 2016
Sold by
Odendahl Teresa Jean
Bought by
179B Llc
Purchase Details
Closed on
Dec 19, 2014
Sold by
Marsh William H and Marsh Patricia S
Bought by
Odendahl Teresa Jean
Home Financials for this Owner
Home Financials are based on the most recent Mortgage that was taken out on this home.
Original Mortgage
$264,800
Interest Rate
4.04%
Mortgage Type
New Conventional
Purchase Details
Closed on
Sep 14, 2012
Sold by
Wu Mintze
Bought by
Marsh Patricia S
Home Financials for this Owner
Home Financials are based on the most recent Mortgage that was taken out on this home.
Original Mortgage
$175,000
Interest Rate
3.59%
Mortgage Type
New Conventional
Purchase Details
Closed on
May 24, 2007
Sold by
Lyons Valley Village Llc
Bought by
Wu Mintze
Create a Home Valuation Report for This Property
The Home Valuation Report is an in-depth analysis detailing your home's value as well as a comparison with similar homes in the area
Purchase History
| Date | Buyer | Sale Price | Title Company |
|---|---|---|---|
| Lippa Drew Murray | $654,500 | Land Title | |
| 179B Llc | -- | None Available | |
| Odendahl Teresa Jean | $331,000 | Land Title Guarantee Company | |
| Marsh Patricia S | $321,000 | Land Title Guarantee Company | |
| Wu Mintze | $355,000 | None Available |
Source: Public Records
Mortgage History
| Date | Status | Borrower | Loan Amount |
|---|---|---|---|
| Previous Owner | Odendahl Teresa Jean | $264,800 | |
| Previous Owner | Marsh Patricia S | $175,000 |
Source: Public Records
Tax History
| Year | Tax Paid | Tax Assessment Tax Assessment Total Assessment is a certain percentage of the fair market value that is determined by local assessors to be the total taxable value of land and additions on the property. | Land | Improvement |
|---|---|---|---|---|
| 2025 | $4,569 | $37,906 | -- | $37,906 |
| 2024 | $4,569 | $37,906 | -- | $37,906 |
| 2023 | $4,507 | $38,417 | -- | $42,102 |
| 2022 | $3,536 | $28,683 | $0 | $28,683 |
| 2021 | $3,494 | $29,508 | $0 | $29,508 |
| 2020 | $3,127 | $26,169 | $0 | $26,169 |
| 2019 | $3,065 | $26,169 | $0 | $26,169 |
| 2018 | $3,055 | $26,604 | $0 | $26,604 |
| 2017 | $3,004 | $29,412 | $0 | $29,412 |
| 2016 | $3,023 | $26,061 | $0 | $26,061 |
| 2015 | $2,874 | $25,074 | $0 | $25,074 |
| 2014 | $2,599 | $25,074 | $0 | $25,074 |
Source: Public Records
Map
Nearby Homes
- 104 Noland Ct
- 350 Mcconnell Dr
- 342 4th Ave
- 618 Overlook Dr
- 121 Osprey Ln
- 17667 Route 7
- 18673 Route 7
- 430 Carter Dr
- 125 Longs Peak Dr
- 1040 5th Ave 2 and 4
- 1040 5th Ave 5
- 223 Stone Canyon Rd
- 0 Apple Valley Rd
- 1117 5th Ave
- 1117 N 5th Ave
- 119 Eagle Canyon Cir
- 2615 Eagle Ridge Rd
- 2685 Eagle Ridge Rd
- 1285 Eagle Ridge Rd
- 1669 Apple Valley Rd
- 177 2nd Ave Unit 6B
- 177 2nd Ave Unit 6A
- 177 2nd Ave Unit B
- 195 2nd Ave
- 197 2nd Ave Unit 7B
- 197 2nd Ave Unit 7A
- 197 2nd Ave Unit A
- 179 2nd Ave Unit 5A
- 179 2nd Ave
- 179 2nd Ave Unit A
- 183 2nd Ave Unit 3B
- 183 2nd Ave Unit 3A
- 183 2nd Ave Unit A
- 183 2nd Ave Unit B
- 181 2nd Ave Unit 4B
- 181 2nd Ave Unit 4A
- 181 2nd Ave Unit A
- 181 2nd Ave
- 181 2nd Ave Unit B
- 191 2nd Ave Unit 10B
Your Personal Tour Guide
Ask me questions while you tour the home.