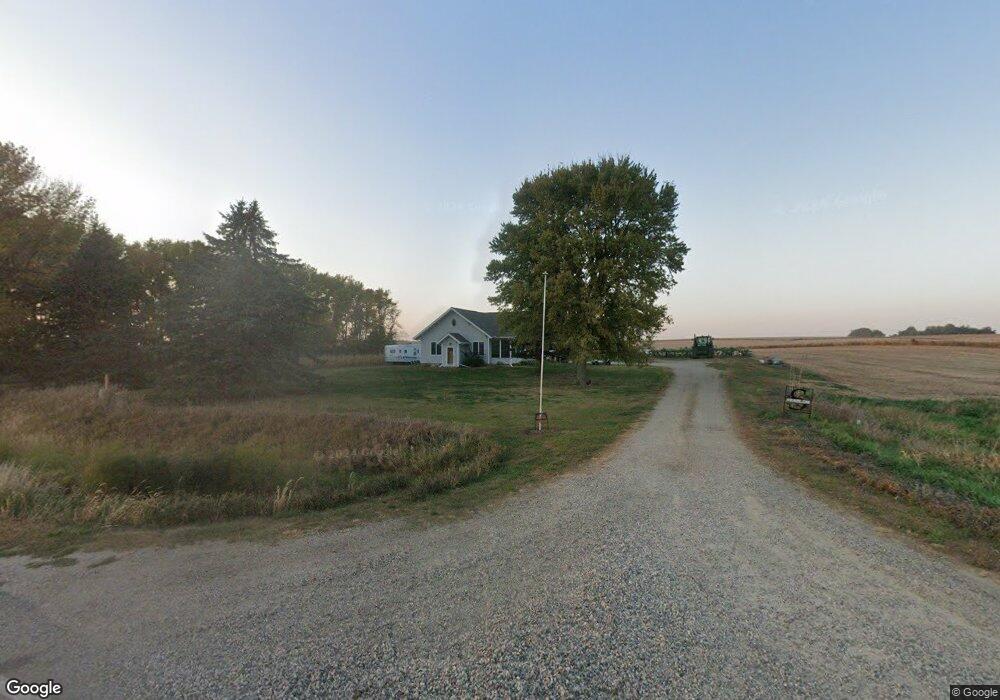
179 610th St Pierson, IA 51048
Estimated Value: $340,000 - $470,000
3
Beds
2
Baths
1,720
Sq Ft
$228/Sq Ft
Est. Value
About This Home
This home is located at 179 610th St, Pierson, IA 51048 and is currently estimated at $392,691, approximately $228 per square foot. 179 610th St is a home located in Cherokee County with nearby schools including MMCRU Marcus Elementary School and MMCRU High School.
Ownership History
Date
Name
Owned For
Owner Type
Purchase Details
Closed on
Dec 30, 2021
Sold by
Seablom and Julie
Bought by
Seablom Tony and Seablom Ashley
Current Estimated Value
Home Financials for this Owner
Home Financials are based on the most recent Mortgage that was taken out on this home.
Original Mortgage
$125,000
Outstanding Balance
$114,967
Interest Rate
3.11%
Mortgage Type
New Conventional
Estimated Equity
$277,724
Purchase Details
Closed on
Aug 27, 2012
Sold by
Rawson Gerald A
Bought by
S & S Farms
Create a Home Valuation Report for This Property
The Home Valuation Report is an in-depth analysis detailing your home's value as well as a comparison with similar homes in the area
Home Values in the Area
Average Home Value in this Area
Purchase History
| Date | Buyer | Sale Price | Title Company |
|---|---|---|---|
| Seablom Tony | $70,000 | Thompson Chad | |
| Seablom Tony | $70,000 | Thompson Chad | |
| S & S Farms | $170,000 | None Available |
Source: Public Records
Mortgage History
| Date | Status | Borrower | Loan Amount |
|---|---|---|---|
| Open | Seablom Tony | $125,000 | |
| Closed | Seablom Tony | $125,000 |
Source: Public Records
Tax History Compared to Growth
Tax History
| Year | Tax Paid | Tax Assessment Tax Assessment Total Assessment is a certain percentage of the fair market value that is determined by local assessors to be the total taxable value of land and additions on the property. | Land | Improvement |
|---|---|---|---|---|
| 2025 | $2,766 | $276,700 | $33,480 | $243,220 |
| 2024 | $2,794 | $251,830 | $26,280 | $225,550 |
| 2023 | $1,960 | $251,830 | $26,280 | $225,550 |
| 2022 | $1,976 | $156,680 | $21,040 | $135,640 |
| 2021 | $1,976 | $158,110 | $22,470 | $135,640 |
| 2020 | $1,774 | $157,850 | $22,220 | $135,630 |
| 2019 | $1,820 | $167,600 | $0 | $0 |
| 2018 | $1,808 | $171,295 | $0 | $0 |
| 2017 | $1,808 | $177,776 | $0 | $0 |
| 2016 | $1,844 | $177,776 | $0 | $0 |
| 2015 | $1,184 | $105,376 | $0 | $0 |
| 2014 | $1,184 | $105,376 | $0 | $0 |
Source: Public Records
Map
Nearby Homes