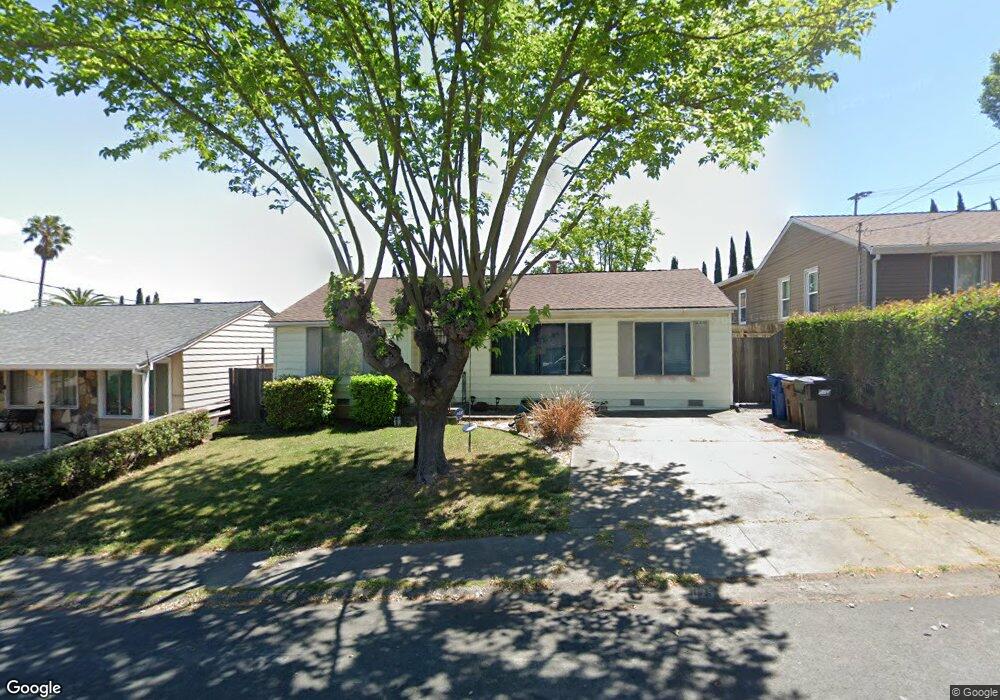
179 El Bonito Way Benicia, CA 94510
Estimated Value: $699,031 - $730,000
4
Beds
1
Bath
1,474
Sq Ft
$484/Sq Ft
Est. Value
About This Home
This home is located at 179 El Bonito Way, Benicia, CA 94510 and is currently estimated at $713,008, approximately $483 per square foot. 179 El Bonito Way is a home located in Solano County with nearby schools including Robert Semple Elementary School, Benicia Middle School, and Benicia High School.
Ownership History
Date
Name
Owned For
Owner Type
Purchase Details
Closed on
Apr 21, 2014
Sold by
Rosano Matthew R
Bought by
Rice Jeremiah and Rice Stephanie
Current Estimated Value
Home Financials for this Owner
Home Financials are based on the most recent Mortgage that was taken out on this home.
Original Mortgage
$373,117
Outstanding Balance
$278,533
Interest Rate
3.87%
Mortgage Type
FHA
Estimated Equity
$434,475
Purchase Details
Closed on
May 25, 2012
Sold by
Rosano Ashley
Bought by
Rosano Matthew R
Home Financials for this Owner
Home Financials are based on the most recent Mortgage that was taken out on this home.
Original Mortgage
$176,000
Interest Rate
3.86%
Mortgage Type
New Conventional
Purchase Details
Closed on
Sep 26, 2000
Sold by
Smyth Ina Raelene
Bought by
Garibaldi Lynda Sue
Purchase Details
Closed on
Apr 30, 1997
Sold by
Grinnell Harry and Grinnell Eunice
Bought by
Grinnell Harry Springer and Grinnell Eunice E
Create a Home Valuation Report for This Property
The Home Valuation Report is an in-depth analysis detailing your home's value as well as a comparison with similar homes in the area
Home Values in the Area
Average Home Value in this Area
Purchase History
| Date | Buyer | Sale Price | Title Company |
|---|---|---|---|
| Rice Jeremiah | $380,000 | First American Title Company | |
| Rosano Matthew R | -- | North American Title Company | |
| Rosano Matthew R | $220,000 | North American Title Company | |
| Garibaldi Lynda Sue | $80,000 | North American Title Co | |
| Grinnell Harry Springer | -- | -- | |
| Grinnell Harry Springer | -- | -- |
Source: Public Records
Mortgage History
| Date | Status | Borrower | Loan Amount |
|---|---|---|---|
| Open | Rice Jeremiah | $373,117 | |
| Previous Owner | Rosano Matthew R | $176,000 |
Source: Public Records
Tax History Compared to Growth
Tax History
| Year | Tax Paid | Tax Assessment Tax Assessment Total Assessment is a certain percentage of the fair market value that is determined by local assessors to be the total taxable value of land and additions on the property. | Land | Improvement |
|---|---|---|---|---|
| 2025 | $5,400 | $467,514 | $109,391 | $358,123 |
| 2024 | $5,400 | $458,348 | $107,247 | $351,101 |
| 2023 | $5,268 | $449,362 | $105,145 | $344,217 |
| 2022 | $5,169 | $440,552 | $103,084 | $337,468 |
| 2021 | $5,062 | $431,914 | $101,063 | $330,851 |
| 2020 | $4,994 | $427,486 | $100,027 | $327,459 |
| 2019 | $4,906 | $419,105 | $98,066 | $321,039 |
| 2018 | $4,779 | $410,889 | $96,144 | $314,745 |
| 2017 | $4,667 | $402,833 | $94,259 | $308,574 |
| 2016 | $4,703 | $394,935 | $92,411 | $302,524 |
| 2015 | $4,583 | $389,003 | $91,023 | $297,980 |
| 2014 | $2,726 | $225,419 | $51,232 | $174,187 |
Source: Public Records
Map
Nearby Homes
- 140 El Bonito Way
- 74 Linda Vista St
- 40 La Cruz Ave
- 1790 Pacifica Ct
- 1811 Pacifica Ct
- 407 Rinconada Ct
- 1781 Lindo St
- 1878 Casa Grande St
- 2135 E 2nd St
- 375 E O St
- 119 Mountview Terrace
- 444 Military E
- 1843 Shirley Dr
- 777 Military E
- 735 Buchanan St Unit 220
- 735 Buchanan St Unit 120
- 735 Buchanan St Unit 114
- 1893 Shirley Dr
- 1885 Shirley Dr
- 1448 Ohare Dr
- 185 El Bonito Way
- 173 El Bonito Way
- 167 El Bonito Way
- 269 Hillcrest Ave
- 265 Hillcrest Ave
- 170 El Bonito Way
- 161 El Bonito Way
- 160 El Bonito Way
- 180 El Bonito Way
- 150 El Bonito Way
- 186 El Bonito Way
- 257 Hillcrest Ave
- 155 El Bonito Way
- 253 Hillcrest Ave
- 149 El Bonito Way
- 14 Del Centro
- 10 Del Centro
- 130 El Bonito Way
- 18 Del Centro
- 6 Del Centro