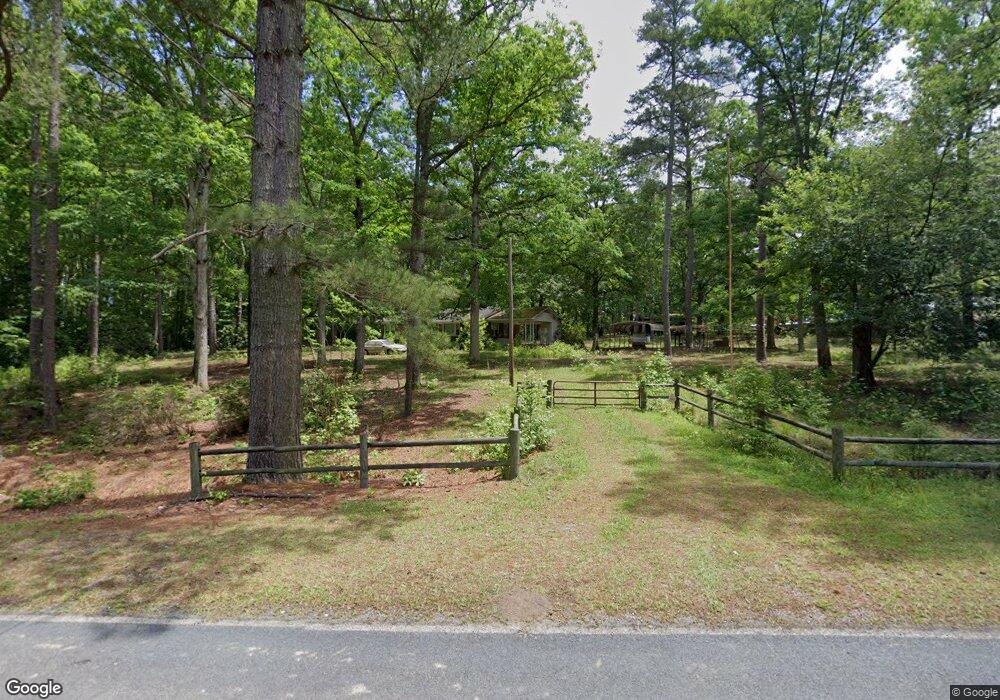
179 Hardy Rd Carthage, NC 28327
Estimated Value: $115,000 - $287,000
2
Beds
1
Bath
1,170
Sq Ft
$188/Sq Ft
Est. Value
About This Home
This home is located at 179 Hardy Rd, Carthage, NC 28327 and is currently estimated at $219,662, approximately $187 per square foot. 179 Hardy Rd is a home located in Moore County with nearby schools including Carthage Elementary School, New Century Middle School, and Union Pines High School.
Ownership History
Date
Name
Owned For
Owner Type
Purchase Details
Closed on
Apr 8, 2013
Sold by
Richardson Thomas Michael and Richardson Bethany T
Bought by
Richardson Thomas Michael and Richardson Bethany T
Current Estimated Value
Create a Home Valuation Report for This Property
The Home Valuation Report is an in-depth analysis detailing your home's value as well as a comparison with similar homes in the area
Home Values in the Area
Average Home Value in this Area
Purchase History
| Date | Buyer | Sale Price | Title Company |
|---|---|---|---|
| Richardson Thomas Michael | -- | None Available |
Source: Public Records
Tax History
| Year | Tax Paid | Tax Assessment Tax Assessment Total Assessment is a certain percentage of the fair market value that is determined by local assessors to be the total taxable value of land and additions on the property. | Land | Improvement |
|---|---|---|---|---|
| 2024 | $702 | $161,410 | $81,480 | $79,930 |
| 2023 | $734 | $161,410 | $81,480 | $79,930 |
| 2022 | $866 | $137,410 | $65,990 | $71,420 |
| 2021 | $900 | $137,410 | $65,990 | $71,420 |
| 2020 | $886 | $130,490 | $65,990 | $64,500 |
| 2019 | $886 | $137,410 | $65,990 | $71,420 |
| 2018 | $859 | $143,190 | $72,570 | $70,620 |
| 2017 | $838 | $143,190 | $72,570 | $70,620 |
| 2015 | $809 | $143,190 | $72,570 | $70,620 |
| 2014 | $588 | $107,030 | $39,450 | $67,580 |
| 2013 | -- | $107,030 | $39,450 | $67,580 |
Source: Public Records
Map
Nearby Homes
Your Personal Tour Guide
Ask me questions while you tour the home.