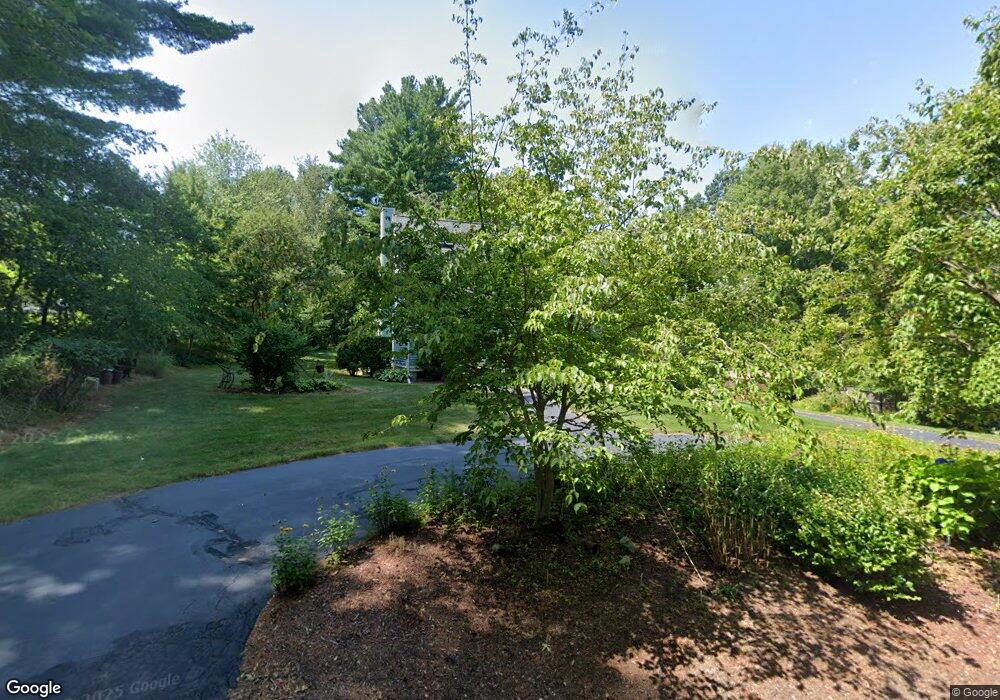
179 King St Groveland, MA 01834
Estimated Value: $696,000 - $741,000
2
Beds
2
Baths
1,822
Sq Ft
$393/Sq Ft
Est. Value
About This Home
This home is located at 179 King St, Groveland, MA 01834 and is currently estimated at $716,857, approximately $393 per square foot. 179 King St is a home located in Essex County with nearby schools including Pentucket Regional High School.
Ownership History
Date
Name
Owned For
Owner Type
Purchase Details
Closed on
Jul 21, 2021
Sold by
Desimone Anthony J
Bought by
Anthony J Desimone Ft
Current Estimated Value
Purchase Details
Closed on
Oct 11, 2002
Sold by
Sullivan Ruth M
Bought by
Desimone Anthony J
Purchase Details
Closed on
Nov 18, 1998
Sold by
Wade Douglas J and Wade Barbara L
Bought by
Sullivan Ruth M
Home Financials for this Owner
Home Financials are based on the most recent Mortgage that was taken out on this home.
Original Mortgage
$195,200
Interest Rate
6.49%
Mortgage Type
Purchase Money Mortgage
Create a Home Valuation Report for This Property
The Home Valuation Report is an in-depth analysis detailing your home's value as well as a comparison with similar homes in the area
Home Values in the Area
Average Home Value in this Area
Purchase History
| Date | Buyer | Sale Price | Title Company |
|---|---|---|---|
| Anthony J Desimone Ft | -- | None Available | |
| Desimone Anthony J | $180,000 | -- | |
| Sullivan Ruth M | $244,000 | -- |
Source: Public Records
Mortgage History
| Date | Status | Borrower | Loan Amount |
|---|---|---|---|
| Previous Owner | Sullivan Ruth M | $195,200 | |
| Previous Owner | Sullivan Ruth M | $135,000 |
Source: Public Records
Tax History Compared to Growth
Tax History
| Year | Tax Paid | Tax Assessment Tax Assessment Total Assessment is a certain percentage of the fair market value that is determined by local assessors to be the total taxable value of land and additions on the property. | Land | Improvement |
|---|---|---|---|---|
| 2025 | $8,254 | $650,400 | $259,600 | $390,800 |
| 2024 | $8,247 | $609,100 | $245,200 | $363,900 |
| 2023 | $7,474 | $569,200 | $222,800 | $346,400 |
| 2022 | $7,306 | $504,900 | $196,700 | $308,200 |
| 2021 | $6,834 | $464,300 | $178,700 | $285,600 |
| 2020 | $6,290 | $447,700 | $165,000 | $282,700 |
| 2019 | $6,193 | $431,600 | $164,700 | $266,900 |
| 2018 | $5,996 | $408,200 | $156,000 | $252,200 |
| 2017 | $5,838 | $397,700 | $156,000 | $241,700 |
| 2016 | $5,620 | $372,400 | $147,200 | $225,200 |
| 2015 | $5,366 | $367,300 | $138,500 | $228,800 |
| 2014 | $5,063 | $336,200 | $138,500 | $197,700 |
Source: Public Records
Map
Nearby Homes
- 231 W Main St
- 206 W Main St Unit 3
- 206 W Main St Unit 5
- 206 W Main St Unit 6
- 206 W Main St Unit 4
- 7 Yale St
- 603 Alyssa Dr Unit 603
- Lot 9 Katie Ln
- Lot 8 Katie Ln
- Lot 11A King St
- 89 King St
- 1 Atwood Ln
- 98 King St
- 123 Pond St
- 51 W Main St Unit 6
- 21 Francis Ave
- 79 Andover St
- 425 Main St
- 34 E Main St Unit 2
- 11 Canterbury Dr