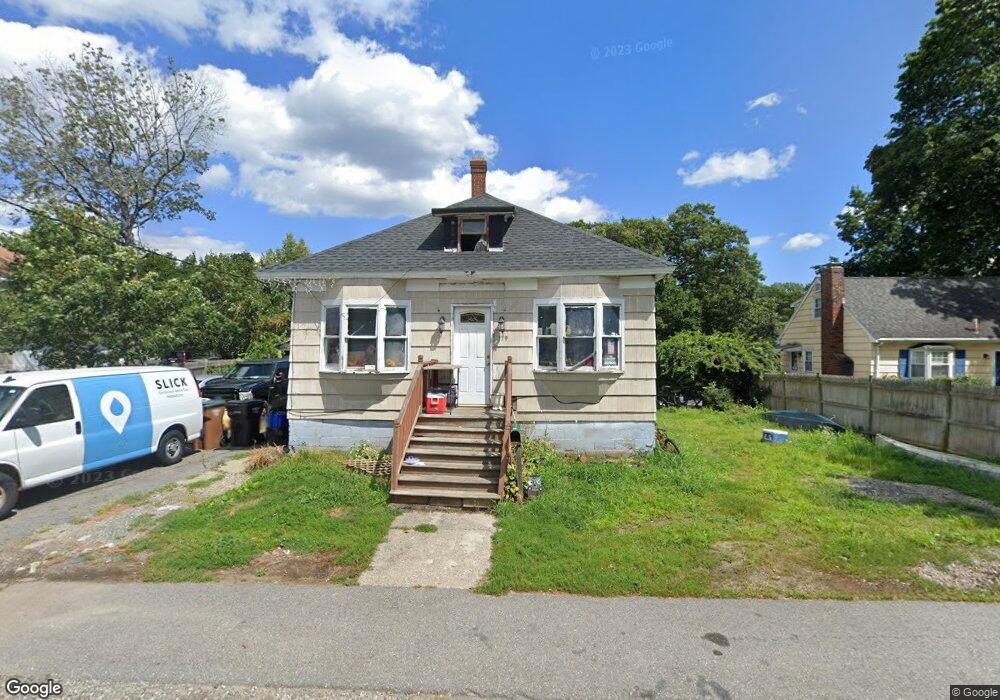
179 Manning St Hudson, MA 01749
Estimated Value: $406,000 - $517,000
3
Beds
1
Bath
1,340
Sq Ft
$345/Sq Ft
Est. Value
About This Home
This home is located at 179 Manning St, Hudson, MA 01749 and is currently estimated at $461,725, approximately $344 per square foot. 179 Manning St is a home located in Middlesex County with nearby schools including David J. Quinn Middle School, Hudson High School, and First Steps Children's Center.
Ownership History
Date
Name
Owned For
Owner Type
Purchase Details
Closed on
Aug 31, 2015
Sold by
Martin Ellen Z
Bought by
Martin Ellen Z and Martin Andrew M
Current Estimated Value
Create a Home Valuation Report for This Property
The Home Valuation Report is an in-depth analysis detailing your home's value as well as a comparison with similar homes in the area
Home Values in the Area
Average Home Value in this Area
Purchase History
| Date | Buyer | Sale Price | Title Company |
|---|---|---|---|
| Martin Ellen Z | -- | -- | |
| Martin Ellen Z | -- | -- |
Source: Public Records
Tax History Compared to Growth
Tax History
| Year | Tax Paid | Tax Assessment Tax Assessment Total Assessment is a certain percentage of the fair market value that is determined by local assessors to be the total taxable value of land and additions on the property. | Land | Improvement |
|---|---|---|---|---|
| 2025 | $4,229 | $304,700 | $159,300 | $145,400 |
| 2024 | $4,063 | $290,200 | $144,800 | $145,400 |
| 2023 | $3,977 | $272,400 | $139,300 | $133,100 |
| 2022 | $3,773 | $237,900 | $126,500 | $111,400 |
| 2021 | $3,706 | $223,400 | $120,600 | $102,800 |
| 2020 | $3,671 | $221,000 | $118,200 | $102,800 |
| 2019 | $7,009 | $209,900 | $118,200 | $91,700 |
| 2018 | $3,201 | $182,900 | $112,500 | $70,400 |
| 2017 | $3,033 | $173,300 | $107,200 | $66,100 |
| 2016 | $2,938 | $169,900 | $107,200 | $62,700 |
| 2015 | $3,673 | $212,700 | $107,200 | $105,500 |
| 2014 | $3,487 | $200,200 | $94,000 | $106,200 |
Source: Public Records
Map
Nearby Homes
- 74 Cox St Unit 9
- 200 Manning St Unit 6C
- 200 Manning St Unit 14B
- 1 Barracks Rd Unit 1
- 104 Lincoln St
- 133 Lincoln St
- 2 Edith Rd
- 55 Cottage St
- 248 Main St Unit 207
- 248 Main St Unit 216
- 26 Marychris Dr
- 76 Woobly Rd
- 65 Main St
- 18-24 River St Unit 1
- 16 Houghton St
- 12 Old County Rd
- 12 Old County Rd Unit 20
- 28 Pierce St
- 11 Barracks Rd Unit 11
- 9 Barracks Rd Unit 9