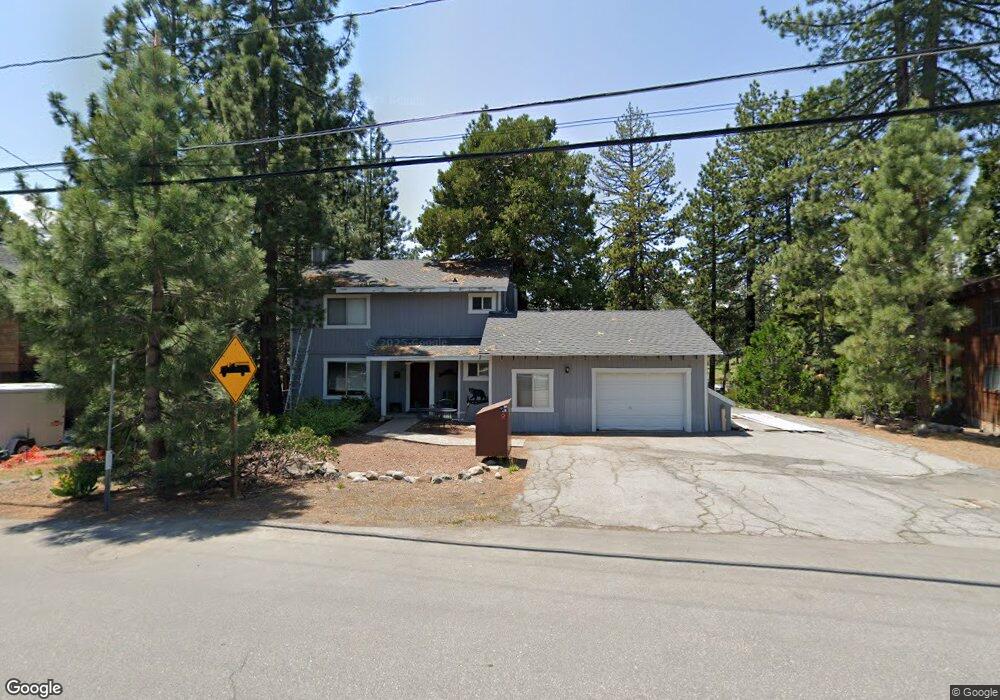
179 Observation Dr Tahoe City, CA 96145
Estimated Value: $1,196,828 - $1,556,000
3
Beds
2
Baths
1,860
Sq Ft
$773/Sq Ft
Est. Value
About This Home
This home is located at 179 Observation Dr, Tahoe City, CA 96145 and is currently estimated at $1,437,457, approximately $772 per square foot. 179 Observation Dr is a home with nearby schools including North Tahoe School, Tahoe Lake Elementary School, and North Tahoe High School.
Ownership History
Date
Name
Owned For
Owner Type
Purchase Details
Closed on
Jun 4, 2024
Sold by
Patrick And Julia Garvey 1988 Family Tru and Garvey Patrick J
Bought by
Michael Joseph Garvey And Linda Diane Kerin G and Garvey
Current Estimated Value
Purchase Details
Closed on
Nov 20, 2020
Sold by
Cardamone Frank A
Bought by
Cardamone Frank A
Purchase Details
Closed on
Sep 23, 2013
Sold by
Garvey Michael J
Bought by
Garvey Michael L
Purchase Details
Closed on
Jun 15, 2000
Sold by
Shambaugh and Linda
Bought by
Shambaugh Gregory W and Shambaugh Linda B
Purchase Details
Closed on
Jan 17, 1994
Sold by
Shambaugh Gregory and Shambaugh Linda
Bought by
Shambaugh Gregory and Shambaugh Linda
Home Financials for this Owner
Home Financials are based on the most recent Mortgage that was taken out on this home.
Original Mortgage
$110,000
Interest Rate
4.1%
Mortgage Type
Purchase Money Mortgage
Create a Home Valuation Report for This Property
The Home Valuation Report is an in-depth analysis detailing your home's value as well as a comparison with similar homes in the area
Home Values in the Area
Average Home Value in this Area
Purchase History
| Date | Buyer | Sale Price | Title Company |
|---|---|---|---|
| Michael Joseph Garvey And Linda Diane Kerin G | $2,000 | None Listed On Document | |
| Cardamone Frank A | -- | None Available | |
| Garvey Michael L | -- | Chicagd Title Company | |
| Garvey Michael J | -- | Chicago Title Company | |
| Shambaugh Gregory W | -- | -- | |
| Shambaugh Gregory | $42,409 | Fidelity National Title |
Source: Public Records
Mortgage History
| Date | Status | Borrower | Loan Amount |
|---|---|---|---|
| Previous Owner | Shambaugh Gregory | $110,000 |
Source: Public Records
Tax History Compared to Growth
Tax History
| Year | Tax Paid | Tax Assessment Tax Assessment Total Assessment is a certain percentage of the fair market value that is determined by local assessors to be the total taxable value of land and additions on the property. | Land | Improvement |
|---|---|---|---|---|
| 2025 | $4,524 | $476,215 | $113,079 | $363,136 |
| 2023 | $4,524 | $327,473 | $75,927 | $251,546 |
| 2022 | $4,283 | $321,053 | $74,439 | $246,614 |
| 2021 | $4,135 | $314,759 | $72,980 | $241,779 |
| 2020 | $4,132 | $311,532 | $72,232 | $239,300 |
| 2019 | $4,165 | $305,424 | $70,816 | $234,608 |
| 2018 | $3,748 | $299,436 | $69,428 | $230,008 |
| 2017 | $3,677 | $293,566 | $68,067 | $225,499 |
| 2016 | $3,634 | $287,811 | $66,733 | $221,078 |
| 2015 | $3,562 | $283,489 | $65,731 | $217,758 |
| 2014 | $3,463 | $277,937 | $64,444 | $213,493 |
Source: Public Records
Map
Nearby Homes
- 3200 N Lake Blvd Unit 12
- 3200 N Lake Blvd Unit 1
- 190 Observation Dr
- 178 Marlette Dr
- 3115 Panorama Dr
- 154 Skyland Way
- 3100 Panorama Dr
- 3100 N Lake Blvd
- 3115 N Lake Blvd Unit 37
- 3115 N Lake Blvd Unit 92
- 3096 N Lake Blvd
- 125 Lassen Dr Unit 28
- 125 Lassen Dr Unit 4
- 3030 Panorama Dr
- 3030 Watson Dr
- 3600 N North Lake Blvd Unit 82
- 20 Observation Dr
- 3101 Lake Forest Rd Unit 42
- 3101 Lake Forest Rd Unit 173
- 3101 Lake Forest Rd Unit 17
- 181 Observation Dr
- 175 Observation Dr
- 173 Observation Dr
- 185 Observation Dr
- 189 Observation Dr
- 171 Observation Dr
- 3200 N Lake Blvd
- 3200 N Lake Blvd Unit 20
- 3200 N Lake Blvd Unit 5
- 3200 N Lake Blvd Unit 3
- 3200 N Lake Blvd Unit 13
- 3200 N Lake Blvd Unit 4
- 3200 N Lake Blvd Unit 18
- 3200 N Lake Blvd Unit 16
- 169 Observation Dr
- 3205 N Lake Blvd
- 179 Dollar Dr
- 161 Mammoth Dr
- 191 Observation Dr
- 165 Observation Dr