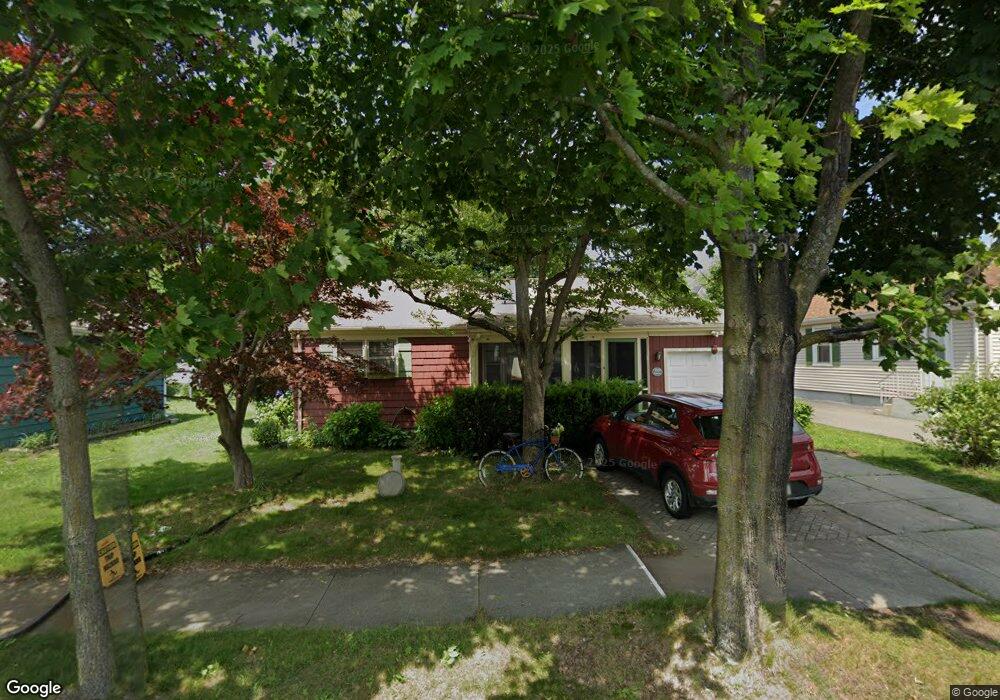
179 Sinclair Ave Cranston, RI 02907
Estimated Value: $340,000 - $351,000
3
Beds
1
Bath
814
Sq Ft
$421/Sq Ft
Est. Value
About This Home
This home is located at 179 Sinclair Ave, Cranston, RI 02907 and is currently estimated at $343,003, approximately $421 per square foot. 179 Sinclair Ave is a home located in Providence County with nearby schools including Highlander Charter School, Paul Cuffee High School, and Sophia Academy.
Ownership History
Date
Name
Owned For
Owner Type
Purchase Details
Closed on
May 16, 2020
Sold by
Fish Donald P
Bought by
Bouchard Nancy and Fish Donald P
Current Estimated Value
Purchase Details
Closed on
Oct 26, 2018
Sold by
Integlia Beth A
Bought by
Mibit Capital Hldg Co
Purchase Details
Closed on
Oct 25, 2018
Sold by
Sheehan Therea F
Bought by
Theresa F Sheehan Ret
Purchase Details
Closed on
Jul 25, 2018
Sold by
Dimizio Edward
Bought by
Sgambellone Alba
Purchase Details
Closed on
Jul 6, 2018
Sold by
Cornell Patrizia and Cornell Christopher V
Bought by
Cornell Patrizia
Purchase Details
Closed on
May 21, 2018
Sold by
Hope Road Land Inv Llc
Bought by
Cranston City Of
Purchase Details
Closed on
Apr 19, 2018
Sold by
Garden Vista Developme
Bought by
Elaine E Bertoldi Ret
Purchase Details
Closed on
Dec 11, 2017
Sold by
Ledversis David and Ledversis Donald
Bought by
Ledversis David and Ledversis Donald
Purchase Details
Closed on
Dec 5, 2017
Sold by
Picerne Ronald R
Bought by
Ronald R S Picerne 198
Purchase Details
Closed on
Nov 20, 2017
Sold by
Garden Vista Dev Llc
Bought by
Ciccone William R and Ciccone Edna V
Purchase Details
Closed on
Sep 22, 2017
Sold by
Levine Edward H
Bought by
Levine Joan C
Purchase Details
Closed on
Aug 25, 2017
Sold by
Gusty Paliotta Ft
Bought by
Scituate Farms Inc
Purchase Details
Closed on
Jun 9, 2017
Sold by
Reservoir Adventures L
Bought by
Dimas Realty Llc
Purchase Details
Closed on
Jun 5, 2017
Sold by
Jordan Realty Rigp
Bought by
Calenda Louis R and Calenda Debra R
Purchase Details
Closed on
May 26, 2017
Sold by
Gosnold Investments Ri
Bought by
Pennymac Loan Services
Purchase Details
Closed on
May 16, 2017
Sold by
Angels Deli Rigp
Bought by
Pnc Bank Na
Create a Home Valuation Report for This Property
The Home Valuation Report is an in-depth analysis detailing your home's value as well as a comparison with similar homes in the area
Purchase History
| Date | Buyer | Sale Price | Title Company |
|---|---|---|---|
| Bouchard Nancy | -- | None Available | |
| Mibit Capital Hldg Co | -- | -- | |
| Theresa F Sheehan Ret | -- | -- | |
| Sgambellone Alba | $3,868 | -- | |
| Sedona Associates Llc | $4,865 | -- | |
| Kryston Diana M | $5,961 | -- | |
| Beaver Industries Rigp | $3,439 | -- | |
| Longship Investments L | $5,010 | -- | |
| Conley Thomas B | $2,116 | -- | |
| Conley Thomas B | $10,878 | -- | |
| Reservoir Adventures L | $6,289 | -- | |
| Fahey Gerard P | $7,832 | -- | |
| Amy Realty Rigp | $3,903 | -- | |
| Conley Investments | $5,917 | -- | |
| East Coast Properties | $2,564 | -- | |
| Rookies Real Estate Ll | $2,800 | -- | |
| Power Assoc Rigp | $9,142 | -- | |
| Manda Panda Partners L | $4,242 | -- | |
| Snow Realty Rigp | $5,999 | -- | |
| Great Island Realty Ri | $3,496 | -- | |
| Title Investment Co Ri | $16,935 | -- | |
| Conley Thomas B | $7,840 | -- | |
| Baseline Realty Llc | $1,954 | -- | |
| Lobuono Corp Llc | $2,388 | -- | |
| Lobuono Corp Llc | $3,006 | -- | |
| Quinn R | $6,916 | -- | |
| Reservoir Adventures L | $10,448 | -- | |
| Amy Realty Rigp | $2,637 | -- | |
| Rookies Real Estate Ll | $10,236 | -- | |
| Cornell Patrizia | -- | -- | |
| Cranston City Of | -- | -- | |
| Elaine E Bertoldi Ret | $379,900 | -- | |
| Ledversis David | -- | -- | |
| Ronald R S Picerne 198 | -- | -- | |
| Ciccone William R | $379,900 | -- | |
| Levine Joan C | -- | -- | |
| Scituate Farms Inc | -- | -- | |
| Cranston City Of | -- | -- | |
| Dimas Realty Llc | $11,489 | -- | |
| Dimizio Edward | $5,112 | -- | |
| Dimizio Edward | $4,501 | -- | |
| Calenda Louis R | $12,977 | -- | |
| Calenda Louis R | $3,096 | -- | |
| Pennymac Loan Services | $1,920 | -- | |
| Pnc Bank Na | $3,024 | -- | |
| Saftel Perry J Est | $5,083 | -- | |
| Department Of Housing & Urban Dev | -- | -- |
Source: Public Records
Mortgage History
| Date | Status | Borrower | Loan Amount |
|---|---|---|---|
| Previous Owner | Wmc Mortgage Corp | $256,500 |
Source: Public Records
Tax History
| Year | Tax Paid | Tax Assessment Tax Assessment Total Assessment is a certain percentage of the fair market value that is determined by local assessors to be the total taxable value of land and additions on the property. | Land | Improvement |
|---|---|---|---|---|
| 2025 | $2,333 | $277,700 | $131,100 | $146,600 |
| 2024 | $3,938 | $214,600 | $88,100 | $126,500 |
| 2023 | $3,938 | $214,600 | $88,100 | $126,500 |
| 2022 | $3,820 | $214,600 | $88,100 | $126,500 |
| 2021 | $3,620 | $147,400 | $59,400 | $88,000 |
| 2020 | $3,620 | $147,400 | $59,400 | $88,000 |
| 2019 | $3,620 | $147,400 | $59,400 | $88,000 |
| 2018 | $3,774 | $118,100 | $54,000 | $64,100 |
| 2017 | $3,774 | $118,100 | $54,000 | $64,100 |
| 2016 | $3,774 | $118,100 | $54,000 | $64,100 |
| 2015 | $3,254 | $98,300 | $42,000 | $56,300 |
| 2014 | $3,318 | $98,300 | $42,000 | $56,300 |
| 2013 | $3,318 | $98,300 | $42,000 | $56,300 |
Source: Public Records
Map
Nearby Homes
- 175 Sinclair Ave
- 183 Sinclair Ave
- 171 Sinclair Ave
- 172 Rutherglen Ave
- 180 Rutherglen Ave
- 187 Sinclair Ave
- 186 Rutherglen Ave
- 180 Sinclair Ave
- 170 Rutherglen Ave
- 174 Sinclair Ave
- 184 Sinclair Ave
- 190 Rutherglen Ave
- 167 Sinclair Ave
- 203 Sinclair Ave
- 196 Rutherglen Ave Unit 198
- 194 Sinclair Ave
- 200 Rutherglen Ave
- 170 Sinclair Ave
- 209 Sinclair Ave
- 206 Rutherglen Ave
Your Personal Tour Guide
Ask me questions while you tour the home.