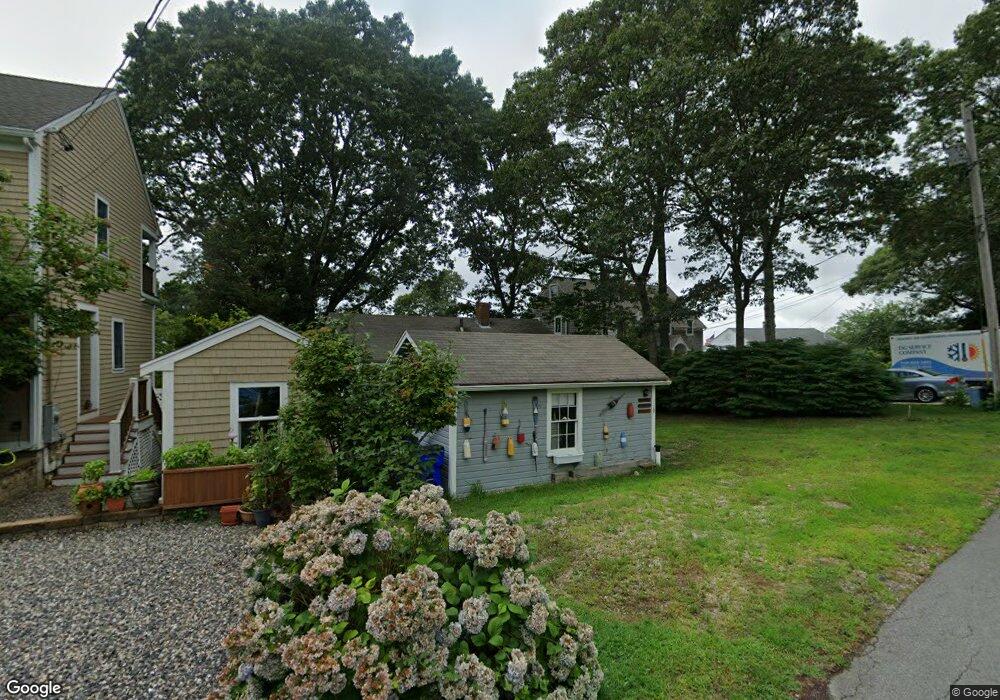
179 Tahanto Rd Pocasset, MA 02559
Pocasset NeighborhoodEstimated Value: $626,000 - $763,000
2
Beds
1
Bath
784
Sq Ft
$909/Sq Ft
Est. Value
About This Home
This home is located at 179 Tahanto Rd, Pocasset, MA 02559 and is currently estimated at $712,656, approximately $909 per square foot. 179 Tahanto Rd is a home located in Barnstable County with nearby schools including Bourne High School, Cadence Academy Preschool - Bourne, and St Margaret Regional School.
Ownership History
Date
Name
Owned For
Owner Type
Purchase Details
Closed on
Apr 26, 2016
Sold by
Feeney Edward X Est and Dimartile
Bought by
Pehowski Linda
Current Estimated Value
Home Financials for this Owner
Home Financials are based on the most recent Mortgage that was taken out on this home.
Original Mortgage
$160,721
Outstanding Balance
$127,337
Interest Rate
3.68%
Mortgage Type
New Conventional
Estimated Equity
$585,319
Create a Home Valuation Report for This Property
The Home Valuation Report is an in-depth analysis detailing your home's value as well as a comparison with similar homes in the area
Home Values in the Area
Average Home Value in this Area
Purchase History
| Date | Buyer | Sale Price | Title Company |
|---|---|---|---|
| Pehowski Linda | $261,800 | -- | |
| Pehowski Linda | $261,800 | -- |
Source: Public Records
Mortgage History
| Date | Status | Borrower | Loan Amount |
|---|---|---|---|
| Open | Pehowski Linda | $160,721 | |
| Closed | Pehowski Linda | $160,721 |
Source: Public Records
Tax History Compared to Growth
Tax History
| Year | Tax Paid | Tax Assessment Tax Assessment Total Assessment is a certain percentage of the fair market value that is determined by local assessors to be the total taxable value of land and additions on the property. | Land | Improvement |
|---|---|---|---|---|
| 2025 | $4,856 | $621,800 | $522,500 | $99,300 |
| 2024 | $4,749 | $592,200 | $497,600 | $94,600 |
| 2023 | $4,622 | $524,600 | $440,400 | $84,200 |
| 2022 | $4,615 | $457,400 | $389,700 | $67,700 |
| 2021 | $1,113 | $416,800 | $354,700 | $62,100 |
| 2020 | $4,408 | $410,400 | $351,300 | $59,100 |
| 2019 | $4,282 | $407,400 | $351,300 | $56,100 |
| 2018 | $4,094 | $388,400 | $334,600 | $53,800 |
| 2017 | $1,271 | $384,600 | $331,400 | $53,200 |
| 2016 | $3,886 | $382,500 | $331,500 | $51,000 |
| 2015 | $3,629 | $360,400 | $309,400 | $51,000 |
Source: Public Records
Map
Nearby Homes