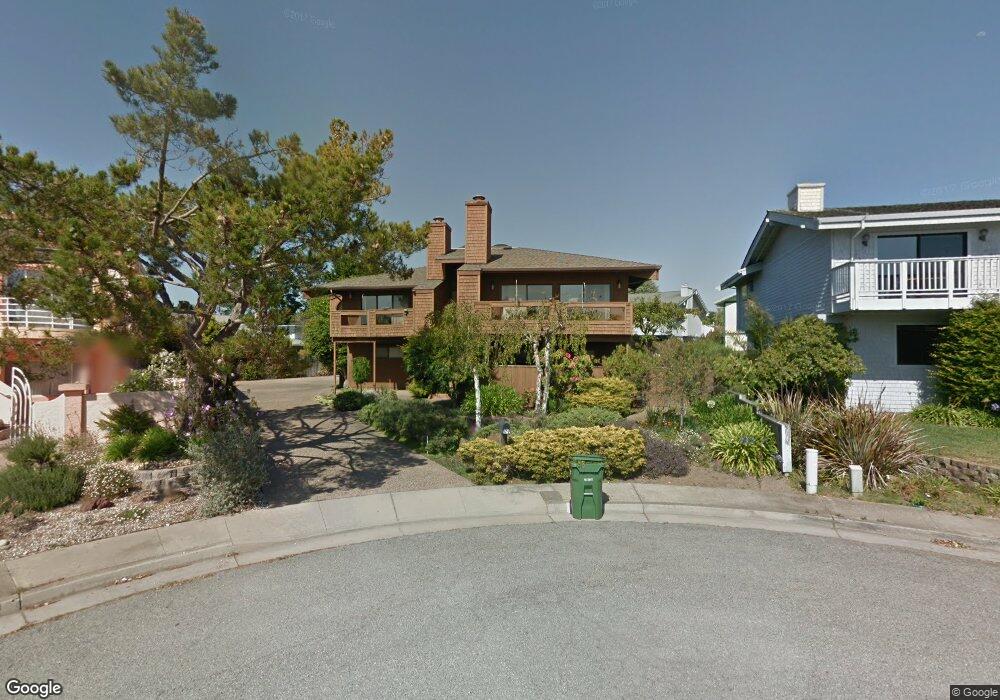
179 Via Soderini Aptos, CA 95003
Rio del Mar NeighborhoodEstimated Value: $1,662,000 - $2,363,000
3
Beds
3
Baths
2,780
Sq Ft
$720/Sq Ft
Est. Value
About This Home
This home is located at 179 Via Soderini, Aptos, CA 95003 and is currently estimated at $2,000,550, approximately $719 per square foot. 179 Via Soderini is a home located in Santa Cruz County with nearby schools including Rio Del Mar Elementary School, Aptos Junior High School, and Aptos High School.
Ownership History
Date
Name
Owned For
Owner Type
Purchase Details
Closed on
Dec 20, 2010
Sold by
Wayne James M and Wayne Chizuko
Bought by
Wayne James M and Wayne Chizuko
Current Estimated Value
Home Financials for this Owner
Home Financials are based on the most recent Mortgage that was taken out on this home.
Original Mortgage
$158,715
Outstanding Balance
$3,578
Interest Rate
4.34%
Mortgage Type
New Conventional
Estimated Equity
$1,996,972
Purchase Details
Closed on
Aug 3, 2001
Sold by
Wayne James M and Wayne Chizuko
Bought by
Wayne James M and Wayne Chizuko
Home Financials for this Owner
Home Financials are based on the most recent Mortgage that was taken out on this home.
Original Mortgage
$140,000
Interest Rate
7.1%
Purchase Details
Closed on
Mar 19, 1998
Sold by
Wayne James M
Bought by
Wayne Chizuko and Wayne James M
Purchase Details
Closed on
Feb 18, 1995
Sold by
Wayne James M
Bought by
Wayne James M and Wayne Chizuko
Create a Home Valuation Report for This Property
The Home Valuation Report is an in-depth analysis detailing your home's value as well as a comparison with similar homes in the area
Home Values in the Area
Average Home Value in this Area
Purchase History
| Date | Buyer | Sale Price | Title Company |
|---|---|---|---|
| Wayne James M | -- | Old Republic Title Company | |
| Wayne Janis M | -- | Old Republic Title Company | |
| Wayne James M | -- | First American Title Co | |
| Wayne James M | -- | First American Title Co | |
| Wayne Chizuko | -- | -- | |
| Wayne James M | -- | -- |
Source: Public Records
Mortgage History
| Date | Status | Borrower | Loan Amount |
|---|---|---|---|
| Open | Wayne Janis M | $158,715 | |
| Closed | Wayne James M | $140,000 |
Source: Public Records
Tax History
| Year | Tax Paid | Tax Assessment Tax Assessment Total Assessment is a certain percentage of the fair market value that is determined by local assessors to be the total taxable value of land and additions on the property. | Land | Improvement |
|---|---|---|---|---|
| 2025 | $10,736 | $884,190 | $442,095 | $442,095 |
| 2023 | $10,511 | $849,856 | $424,928 | $424,928 |
| 2022 | $10,282 | $833,192 | $416,596 | $416,596 |
| 2021 | $9,971 | $816,854 | $408,427 | $408,427 |
| 2020 | $9,804 | $808,478 | $404,239 | $404,239 |
| 2019 | $9,629 | $792,626 | $396,313 | $396,313 |
| 2018 | $9,369 | $777,084 | $388,542 | $388,542 |
| 2017 | $9,283 | $761,848 | $380,924 | $380,924 |
| 2016 | $9,052 | $746,910 | $373,455 | $373,455 |
| 2015 | $8,967 | $735,690 | $367,845 | $367,845 |
| 2014 | $8,758 | $721,278 | $360,639 | $360,639 |
Source: Public Records
Map
Nearby Homes
- 123 Seascape Resort Dr
- 221 Seascape Resort Dr
- 2110 Dolphin Dr
- 117 Seascape Resort Dr
- 312 Seascape Resort Dr
- 2104 Penasquitas Dr
- 211 Seascape Resort Dr
- 2122 Penasquitas Dr
- 2146 Penasquitas Dr
- 1572 Seascape Blvd
- 302 Seascape Resort Dr
- 60 Seascape Resort Dr
- 22 Seascape Resort Dr
- 1514 Dolphin Dr
- 124 Lagunitas Ct
- 153 Castillo Ct
- 308 Ventana Way
- 3 Playa Blvd
- 1585 San Andreas Rd
- 14 Morehouse Dr
- 171 Via Soderini
- 187 Via Soderini
- 159 Via Medici
- 165 Via Medici
- 149 Via Medici
- 1654 Calypso Dr
- 163 Via Soderini
- 141 Via Medici
- 1676 Calypso Dr
- 193 Via Soderini
- 1640 Calypso Dr
- 133 Via Medici
- 155 Via Soderini
- 205 Via Soderini
- 200 Via Soderini
- 125 Via Medici
- 1622 Calypso Dr
- 1667 Calypso Dr
- 147 Via Soderini
- 160 Via Soderini
Your Personal Tour Guide
Ask me questions while you tour the home.