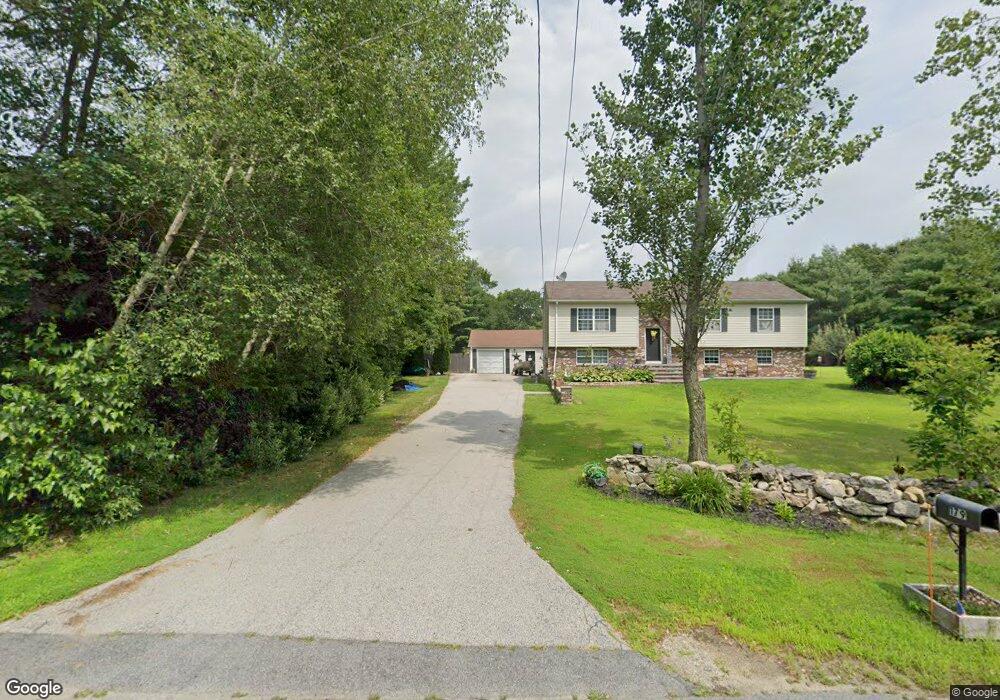
179 Walnut St Douglas, MA 01516
Estimated Value: $494,441 - $551,000
3
Beds
2
Baths
1,044
Sq Ft
$493/Sq Ft
Est. Value
About This Home
This home is located at 179 Walnut St, Douglas, MA 01516 and is currently estimated at $514,610, approximately $492 per square foot. 179 Walnut St is a home located in Worcester County with nearby schools including Douglas Primary School, Douglas Middle School, and Douglas High School.
Ownership History
Date
Name
Owned For
Owner Type
Purchase Details
Closed on
Oct 29, 1999
Sold by
Hadlock Russell W and Hadlock Deborah J
Bought by
Pinto Avelino A and Pinto Laurie A
Current Estimated Value
Purchase Details
Closed on
Aug 1, 1995
Sold by
Guaranteed Bldrs&Dev
Bought by
Hadlock Russell W and Hadlock Deborah
Purchase Details
Closed on
Apr 4, 1994
Sold by
Guaranteed Bldrs & Dev
Bought by
Zmetra Mary A
Purchase Details
Closed on
Mar 16, 1994
Sold by
Guaranteed Bldrs & Dev
Bought by
Zmetra Mary A
Purchase Details
Closed on
Feb 20, 1992
Sold by
Neslusan Gweneth
Bought by
Blanchflower Michael
Create a Home Valuation Report for This Property
The Home Valuation Report is an in-depth analysis detailing your home's value as well as a comparison with similar homes in the area
Home Values in the Area
Average Home Value in this Area
Purchase History
| Date | Buyer | Sale Price | Title Company |
|---|---|---|---|
| Pinto Avelino A | $161,000 | -- | |
| Hadlock Russell W | $129,532 | -- | |
| Guaranteed Bldrs&Dev | $25,000 | -- | |
| Zmetra Mary A | $150,000 | -- | |
| Zmetra Mary A | $21,000 | -- | |
| Blanchflower Michael | $25,000 | -- |
Source: Public Records
Mortgage History
| Date | Status | Borrower | Loan Amount |
|---|---|---|---|
| Open | Blanchflower Michael | $164,077 | |
| Closed | Blanchflower Michael | $33,150 |
Source: Public Records
Tax History
| Year | Tax Paid | Tax Assessment Tax Assessment Total Assessment is a certain percentage of the fair market value that is determined by local assessors to be the total taxable value of land and additions on the property. | Land | Improvement |
|---|---|---|---|---|
| 2025 | $5,493 | $417,100 | $115,100 | $302,000 |
| 2024 | $5,369 | $397,100 | $104,600 | $292,500 |
| 2023 | $5,286 | $368,100 | $104,600 | $263,500 |
| 2022 | $5,126 | $313,700 | $98,600 | $215,100 |
| 2021 | $4,868 | $291,600 | $93,800 | $197,800 |
| 2020 | $4,793 | $282,300 | $93,800 | $188,500 |
| 2019 | $4,741 | $270,900 | $93,800 | $177,100 |
| 2018 | $4,086 | $263,600 | $93,800 | $169,800 |
| 2017 | $3,980 | $247,600 | $97,100 | $150,500 |
| 2016 | $4,045 | $240,500 | $97,100 | $143,400 |
| 2015 | $3,959 | $240,500 | $97,100 | $143,400 |
Source: Public Records
Map
Nearby Homes
- 48 Walnut St
- 59 Old Farm Rd
- 2535 Wallum Lake Rd
- 11 Old Farm Rd
- 38 Hemlock St
- 32 Hemlock St
- 240 South St
- 10 Essex St
- Lot 27 Cedar St
- 3 S East Main St
- 9 Church St
- 0 Wallum Lake Rd
- 60 Webster St
- 16 Hilltop Dr
- 121 New Rd
- 117 New Rd
- 295 S East Main St Unit Lot 6
- 279 S East Main St Unit Lot 2
- 299 S East Main St Unit Lot 7
- 303 S East Main St Unit Lot 8
Your Personal Tour Guide
Ask me questions while you tour the home.