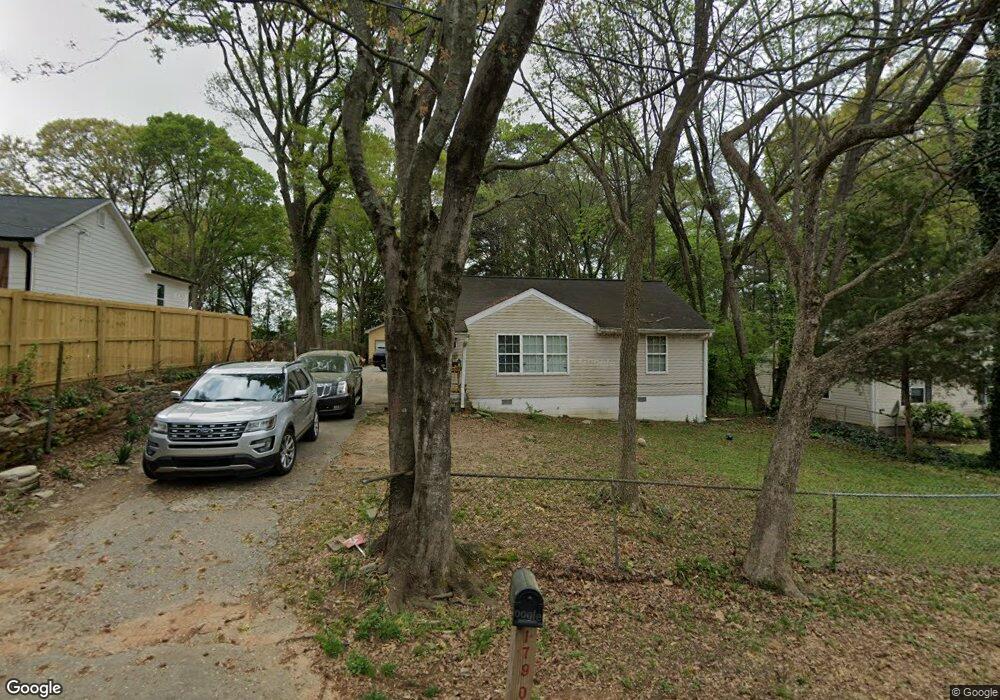
1790 Clearview St SE Marietta, GA 30060
Estimated Value: $248,000 - $358,000
2
Beds
2
Baths
1,216
Sq Ft
$250/Sq Ft
Est. Value
About This Home
This home is located at 1790 Clearview St SE, Marietta, GA 30060 and is currently estimated at $303,399, approximately $249 per square foot. 1790 Clearview St SE is a home located in Cobb County with nearby schools including Green Acres Elementary School, Campbell High School, and International Academy of Smyrna.
Ownership History
Date
Name
Owned For
Owner Type
Purchase Details
Closed on
Feb 14, 2025
Sold by
Henry Lashundra and Williams Lashundra
Bought by
Henry Lashundra
Current Estimated Value
Home Financials for this Owner
Home Financials are based on the most recent Mortgage that was taken out on this home.
Original Mortgage
$170,000
Outstanding Balance
$168,842
Interest Rate
6.91%
Mortgage Type
New Conventional
Estimated Equity
$134,557
Purchase Details
Closed on
May 30, 2007
Sold by
Bogdala Allee N
Bought by
Williams Lashundra
Home Financials for this Owner
Home Financials are based on the most recent Mortgage that was taken out on this home.
Original Mortgage
$113,998
Interest Rate
6.12%
Mortgage Type
FHA
Purchase Details
Closed on
Oct 4, 2006
Sold by
Deutsche Bk Natl Co
Bought by
Bogdala Allee N
Purchase Details
Closed on
Sep 5, 2006
Sold by
Thompson Nathan M
Bought by
Deutsche Bk Na Trust Co
Create a Home Valuation Report for This Property
The Home Valuation Report is an in-depth analysis detailing your home's value as well as a comparison with similar homes in the area
Home Values in the Area
Average Home Value in this Area
Purchase History
| Date | Buyer | Sale Price | Title Company |
|---|---|---|---|
| Henry Lashundra | -- | None Listed On Document | |
| Henry Lashundra | -- | None Listed On Document | |
| Williams Lashundra | $114,900 | -- | |
| Bogdala Allee N | $45,000 | -- | |
| Deutsche Bk Na Trust Co | $63,220 | -- |
Source: Public Records
Mortgage History
| Date | Status | Borrower | Loan Amount |
|---|---|---|---|
| Open | Henry Lashundra | $170,000 | |
| Closed | Henry Lashundra | $170,000 | |
| Previous Owner | Williams Lashundra | $113,998 |
Source: Public Records
Tax History Compared to Growth
Tax History
| Year | Tax Paid | Tax Assessment Tax Assessment Total Assessment is a certain percentage of the fair market value that is determined by local assessors to be the total taxable value of land and additions on the property. | Land | Improvement |
|---|---|---|---|---|
| 2025 | $2,454 | $81,460 | $44,368 | $37,092 |
| 2024 | $2,456 | $81,460 | $44,368 | $37,092 |
| 2023 | $2,233 | $74,064 | $39,932 | $34,132 |
| 2022 | $1,627 | $53,620 | $29,580 | $24,040 |
| 2021 | $1,367 | $45,040 | $26,620 | $18,420 |
| 2020 | $1,098 | $36,168 | $17,748 | $18,420 |
| 2019 | $810 | $36,168 | $17,748 | $18,420 |
| 2018 | $549 | $27,100 | $10,352 | $16,748 |
| 2017 | $523 | $27,100 | $10,352 | $16,748 |
| 2016 | $459 | $24,840 | $8,872 | $15,968 |
| 2015 | $508 | $26,072 | $10,352 | $15,720 |
| 2014 | $512 | $26,072 | $0 | $0 |
Source: Public Records
Map
Nearby Homes
- 1782 Clearview St SE
- 1774 Clearview St SE
- 420 Tibbetts St SE
- 411 Warner St SE
- 401 Warner St SE
- 1791 Clearview St SE
- 0 Clearview St SE Unit 7210767
- 0 Tibbetts St SE Unit 8028355
- 0 Tibbetts St SE Unit 7330880
- 0 Tibbetts St SE
- 428 Tibbetts St SE
- 421 Warner St SE
- 1764 Clearview St SE
- 387 Warner St SE
- 431 Warner St SE
- 421 Tibbetts St SE
- 1754 Clearview St SE
- 429 Tibbetts St SE
- 400 Warner St SE
- 410 Warner St SE