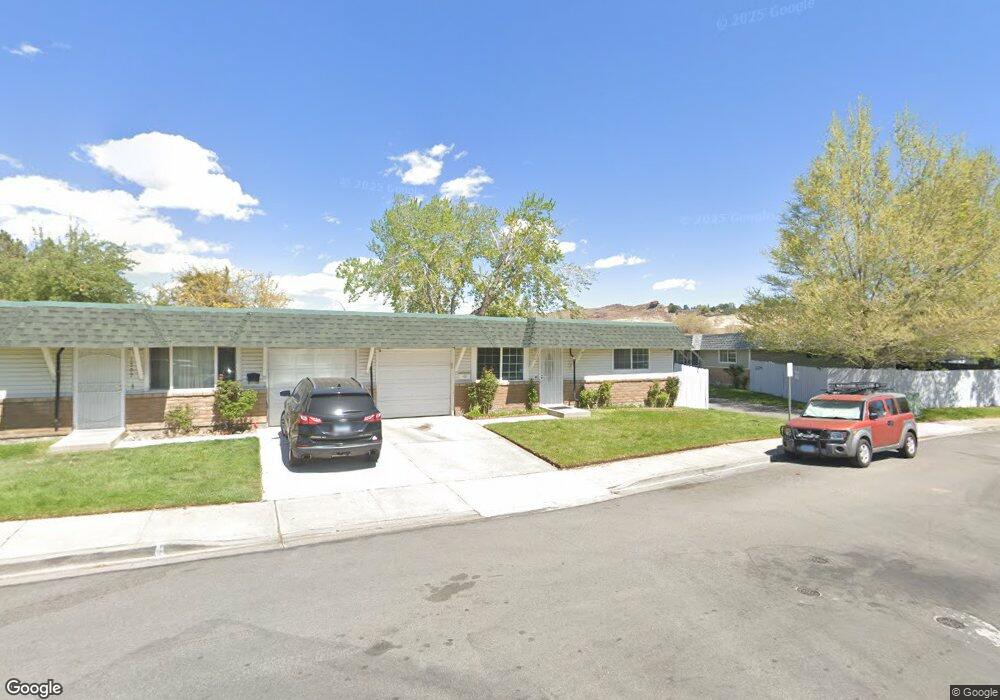
1790 Gault Way Unit E Sparks, NV 89431
North Rock NeighborhoodEstimated Value: $282,260 - $304,000
3
Beds
2
Baths
1,040
Sq Ft
$282/Sq Ft
Est. Value
About This Home
This home is located at 1790 Gault Way Unit E, Sparks, NV 89431 and is currently estimated at $293,065, approximately $281 per square foot. 1790 Gault Way Unit E is a home located in Washoe County with nearby schools including Alice Maxwell Elementary School, Sparks Middle School, and Sparks High School.
Ownership History
Date
Name
Owned For
Owner Type
Purchase Details
Closed on
May 5, 2005
Sold by
Vargas Oscar M and Vargas Maria S
Bought by
Penate Miguel
Current Estimated Value
Home Financials for this Owner
Home Financials are based on the most recent Mortgage that was taken out on this home.
Original Mortgage
$140,000
Outstanding Balance
$73,699
Interest Rate
5.99%
Mortgage Type
Stand Alone First
Estimated Equity
$219,366
Purchase Details
Closed on
May 26, 2000
Sold by
Utu Patricia A and Owens Catherine M
Bought by
Vargas Oscar M and Vargas Maria S
Home Financials for this Owner
Home Financials are based on the most recent Mortgage that was taken out on this home.
Original Mortgage
$84,659
Interest Rate
8.08%
Purchase Details
Closed on
Nov 22, 1994
Sold by
Turville Freeman James T and Turville Freeman Cheryl
Bought by
Utu Patricia A and Owens Catherine M
Create a Home Valuation Report for This Property
The Home Valuation Report is an in-depth analysis detailing your home's value as well as a comparison with similar homes in the area
Home Values in the Area
Average Home Value in this Area
Purchase History
| Date | Buyer | Sale Price | Title Company |
|---|---|---|---|
| Penate Miguel | $175,000 | First Centennial Title Co | |
| Vargas Oscar M | $86,000 | First Centennial Title Co | |
| Utu Patricia A | $67,000 | Founders Title Company |
Source: Public Records
Mortgage History
| Date | Status | Borrower | Loan Amount |
|---|---|---|---|
| Open | Penate Miguel | $140,000 | |
| Previous Owner | Vargas Oscar M | $84,659 |
Source: Public Records
Tax History Compared to Growth
Tax History
| Year | Tax Paid | Tax Assessment Tax Assessment Total Assessment is a certain percentage of the fair market value that is determined by local assessors to be the total taxable value of land and additions on the property. | Land | Improvement |
|---|---|---|---|---|
| 2025 | $591 | $39,758 | $26,002 | $13,756 |
| 2024 | $591 | $38,401 | $24,539 | $13,863 |
| 2023 | $575 | $33,506 | $21,513 | $11,993 |
| 2022 | $558 | $27,686 | $17,556 | $10,130 |
| 2021 | $542 | $21,178 | $11,239 | $9,939 |
| 2020 | $525 | $21,600 | $11,239 | $10,361 |
| 2019 | $510 | $21,844 | $11,438 | $10,406 |
| 2018 | $495 | $17,501 | $6,983 | $10,518 |
| 2017 | $468 | $16,545 | $6,384 | $10,161 |
| 2016 | $457 | $15,830 | $5,220 | $10,610 |
| 2015 | $455 | $15,359 | $4,223 | $11,136 |
| 2014 | $442 | $13,801 | $2,893 | $10,908 |
| 2013 | -- | $13,355 | $2,294 | $11,061 |
Source: Public Records
Map
Nearby Homes
- 1731 Gault Way Unit D
- 1620 Gault Way
- 1595 York Way
- 0 N Mccarran Blvd Unit 250052909
- 1345 Plymouth Way
- 2154 Oppio St
- 1799 Vance Way
- 1655 Byrd Dr
- 1125 Dodson Way
- 1160 York Way
- 3269 Valley Forge Way
- 3116 Sterling Ridge Cir
- 3516 Brassie Dr
- 1110 Xman Way
- 3230 Creekside Ln Unit 1
- 1780 Greenbrae Dr
- 3211 Cityview Terrace
- 5530 High Rock Way
- 1124 Sbragia Way
- 3580 Mashie Ct Unit 1
- 1792 Gault Way
- 1780 Gault Way
- 1770 Gault Way
- 1782 Gault Way Unit E
- 1772 Gault Way
- 1762 Gault Way Unit D
- 2678 Adel Way Unit D
- 2665 Adel Way Unit E
- 2676 Adel Way
- 1760 Gault Way Unit C
- 2664 Adel Way Unit B
- 2663 Adel Way Unit 8
- 2663 Adel Way Unit F
- 1759 Gault Way
- 1742 Gault Way Unit B
- 1742 Gault Way Unit Ground Level
- 2662 Adel Way
- 1757 Gault Way Unit B
- 1740 Gault Way Unit A
- 1733 Gault Way Unit C