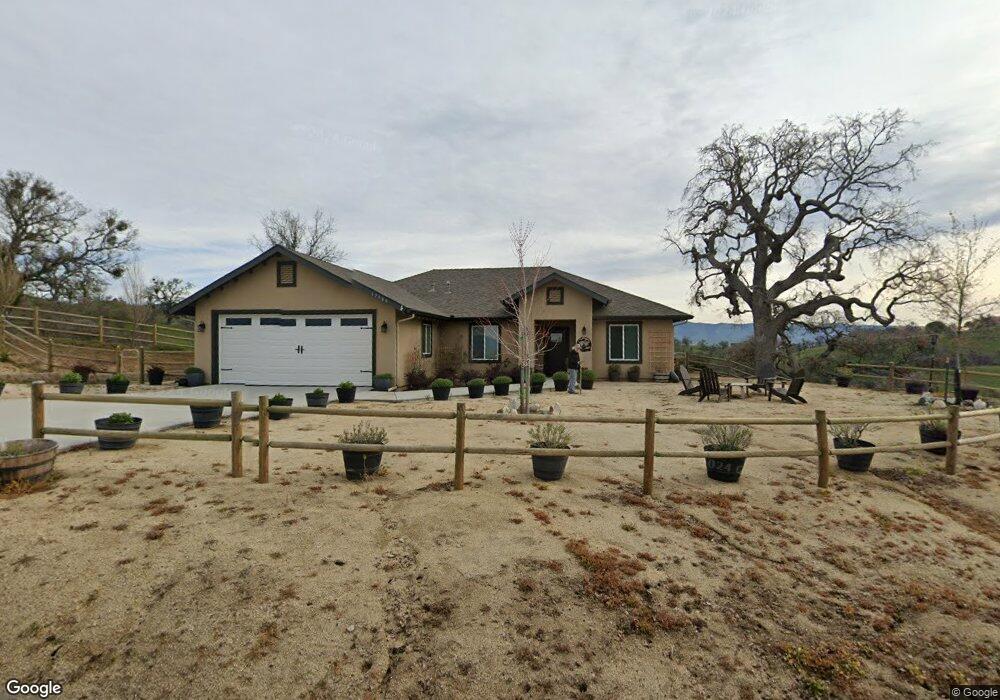
17900 Tejon Dr Tehachapi, CA 93561
Estimated Value: $483,332 - $552,000
3
Beds
2
Baths
1,895
Sq Ft
$279/Sq Ft
Est. Value
About This Home
This home is located at 17900 Tejon Dr, Tehachapi, CA 93561 and is currently estimated at $529,583, approximately $279 per square foot. 17900 Tejon Dr is a home with nearby schools including Cummings Valley Elementary School, Jacobsen Middle School, and Tehachapi High School.
Ownership History
Date
Name
Owned For
Owner Type
Purchase Details
Closed on
Jun 17, 2021
Sold by
Schneir Harvey G and Schneir Cathy S
Bought by
Schneir Harvey G and Schneir Cathy S
Current Estimated Value
Purchase Details
Closed on
Oct 15, 2020
Sold by
Lemke David C
Bought by
Schneir Harvey G and Schneir Cathy S
Home Financials for this Owner
Home Financials are based on the most recent Mortgage that was taken out on this home.
Original Mortgage
$242,000
Interest Rate
2.7%
Mortgage Type
New Conventional
Purchase Details
Closed on
Aug 20, 2019
Sold by
Kackert Thomas J
Bought by
Lemke David C
Purchase Details
Closed on
Sep 11, 2012
Sold by
Kackert Thomas J and Kackert Virginia S
Bought by
Kackert Thomas J and Kackert Virginia Selby
Purchase Details
Closed on
Mar 4, 2002
Sold by
Gallien Guy and Brooks Ann Q
Bought by
Kackert Thomas J and Kackert Virginia S
Create a Home Valuation Report for This Property
The Home Valuation Report is an in-depth analysis detailing your home's value as well as a comparison with similar homes in the area
Home Values in the Area
Average Home Value in this Area
Purchase History
| Date | Buyer | Sale Price | Title Company |
|---|---|---|---|
| Schneir Harvey G | -- | None Available | |
| Schneir Harvey G | $392,000 | First American Title Company | |
| Lemke David C | $25,000 | First American Title | |
| Kackert Thomas J | -- | None Available | |
| Kackert Thomas J | $22,000 | Chicago Title Co |
Source: Public Records
Mortgage History
| Date | Status | Borrower | Loan Amount |
|---|---|---|---|
| Previous Owner | Schneir Harvey G | $242,000 |
Source: Public Records
Tax History
| Year | Tax Paid | Tax Assessment Tax Assessment Total Assessment is a certain percentage of the fair market value that is determined by local assessors to be the total taxable value of land and additions on the property. | Land | Improvement |
|---|---|---|---|---|
| 2025 | $5,244 | $424,310 | $86,593 | $337,717 |
| 2024 | $5,066 | $415,992 | $84,896 | $331,096 |
| 2023 | $5,066 | $407,836 | $83,232 | $324,604 |
| 2022 | $5,023 | $399,840 | $81,600 | $318,240 |
| 2021 | $4,373 | $339,259 | $25,259 | $314,000 |
| 2020 | $535 | $25,000 | $25,000 | $0 |
| 2019 | $592 | $29,708 | $29,708 | $0 |
| 2018 | $579 | $28,555 | $28,555 | $0 |
| 2017 | $578 | $27,996 | $27,996 | $0 |
| 2016 | $518 | $27,448 | $27,448 | $0 |
| 2015 | $552 | $27,036 | $27,036 | $0 |
| 2014 | $548 | $26,507 | $26,507 | $0 |
Source: Public Records
Map
Nearby Homes
- 29300 Horsethief Dr
- 0 Horsethief Dr Unit LOT81
- 18271 Caparell Ct
- 18571 Glenview Ct
- 1 Poso Ct
- 18671 Buckeye Place
- 0 San Joaquin Dr Unit 9990132
- 0 San Joaquin Dr Unit 9991325
- 0 Buckeye Place Unit 202411029
- 28881 Shannon Ct Unit 27
- 28881 Shannon Ct Unit 4
- 0 Stallion Springs and Spyglass Unit 25599401
- 28701 Delaware Dr
- 28401 Stallion Springs Dr
- 0 Alameda Place
- 28551 Delaware Dr
- 18750 Alameda Place
- 28420 Delaware Dr
- 0 High Echelon Ct
- 29661 Alejandro Ct
- 17851 Tejon Dr
- 17800 Tejon Dr
- 18000 Tejon Dr
- 0 Tejon Dr Unit SR14201111
- 0 Tejon Dr Unit 9958693
- 0 Tejon Dr Unit 9968889
- 0 Tejon Dr Unit 9974770
- 0 Tejon Dr Unit 9979487
- 0 Tejon Dr Unit 9986735
- 0 Tejon Dr Unit LOT 107 9986735
- 0 Tejon Dr Unit 1410646
- 0 Tejon Dr Unit 19006898
- 0 Tejon Dr Unit 9977239
- 0 Tejon Dr Unit SR19146639
- Lot 92 Tejon Dr
- 17981 Tejon Dr
- 18040 Tejon Dr
- 29290 Horsethief Dr
- 18020 Tejon Dr
- 18081 Tejon Dr
Your Personal Tour Guide
Ask me questions while you tour the home.