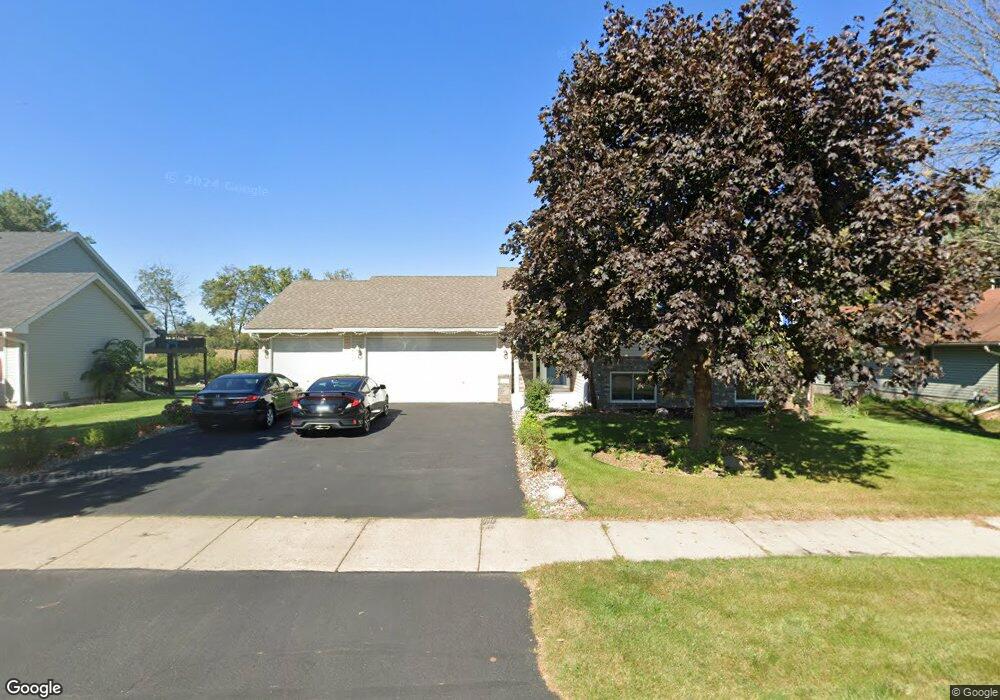
1791 127th Ave NE Minneapolis, MN 55449
Estimated Value: $397,000 - $439,000
4
Beds
2
Baths
2,502
Sq Ft
$170/Sq Ft
Est. Value
About This Home
This home is located at 1791 127th Ave NE, Minneapolis, MN 55449 and is currently estimated at $426,232, approximately $170 per square foot. 1791 127th Ave NE is a home located in Anoka County with nearby schools including Johnsville Elementary School, Northdale Middle School, and Blaine Senior High School.
Ownership History
Date
Name
Owned For
Owner Type
Purchase Details
Closed on
Feb 16, 2021
Sold by
Wayman Matthew J and Wayman Gerilyn M
Bought by
Tran Van Trung and Duong Thi Ngoc
Current Estimated Value
Home Financials for this Owner
Home Financials are based on the most recent Mortgage that was taken out on this home.
Original Mortgage
$289,600
Outstanding Balance
$259,015
Interest Rate
2.7%
Mortgage Type
New Conventional
Estimated Equity
$167,217
Purchase Details
Closed on
Apr 18, 2016
Sold by
Ingvaldsen Amanda and Ingvaldsen Shawn P
Bought by
Wayman Matthew J and Wayman Gerilyn M
Home Financials for this Owner
Home Financials are based on the most recent Mortgage that was taken out on this home.
Original Mortgage
$270,019
Interest Rate
3.75%
Mortgage Type
FHA
Purchase Details
Closed on
Oct 29, 1996
Sold by
Shamrock Development Inc
Bought by
Northland Suburban Homes Inc
Create a Home Valuation Report for This Property
The Home Valuation Report is an in-depth analysis detailing your home's value as well as a comparison with similar homes in the area
Home Values in the Area
Average Home Value in this Area
Purchase History
| Date | Buyer | Sale Price | Title Company |
|---|---|---|---|
| Tran Van Trung | $362,000 | Titlesmart Inc | |
| Wayman Matthew J | $275,000 | Burnet Title | |
| Northland Suburban Homes Inc | $27,500 | -- | |
| Vanvanvanvantran Van Van | $362,000 | -- |
Source: Public Records
Mortgage History
| Date | Status | Borrower | Loan Amount |
|---|---|---|---|
| Open | Tran Van Trung | $289,600 | |
| Previous Owner | Wayman Matthew J | $270,019 |
Source: Public Records
Tax History Compared to Growth
Tax History
| Year | Tax Paid | Tax Assessment Tax Assessment Total Assessment is a certain percentage of the fair market value that is determined by local assessors to be the total taxable value of land and additions on the property. | Land | Improvement |
|---|---|---|---|---|
| 2025 | $4,138 | $408,600 | $110,000 | $298,600 |
| 2024 | $4,138 | $394,400 | $108,200 | $286,200 |
| 2023 | $3,768 | $397,100 | $103,000 | $294,100 |
| 2022 | $3,453 | $393,800 | $90,000 | $303,800 |
| 2021 | $3,212 | $322,600 | $75,000 | $247,600 |
| 2020 | $3,148 | $295,200 | $75,000 | $220,200 |
| 2019 | $2,999 | $279,500 | $67,000 | $212,500 |
| 2018 | $2,916 | $261,700 | $0 | $0 |
| 2017 | $2,586 | $249,300 | $0 | $0 |
| 2016 | $2,797 | $222,600 | $0 | $0 |
| 2015 | -- | $222,600 | $64,700 | $157,900 |
| 2014 | -- | $193,700 | $52,000 | $141,700 |
Source: Public Records
Map
Nearby Homes
- XXXX Radisson Rd NE
- 1876 129th Ave NE
- 1773 124th Ave NE
- 1948 130th Ln NE
- 12741 Owatonna St NE
- 1653 123rd Ave NE
- 12775 Ulysses Cir NE
- 2204 128th Ln NE
- 12209 Davenport St NE
- 12980 Ulysses St NE
- 1409 131st Ave NE
- 1756 132nd Ave NE
- 13018 Ulysses St NE
- 12101 Hastings St NE
- 1156 128th Ave NE
- 2253 130th Ct NE
- 1936 121st Ave NE
- 2329 130th Ct NE
- 1132 Buchanan Cir NE
- 1234 123rd Ave NE
- 1807 127th Ave NE
- 1779 127th Ave NE
- 12689 Goodhue St NE
- 1819 127th Ave NE
- 1767 127th Ave NE
- 12688 Hastings St NE
- 1831 127th Ave NE
- 12671 Goodhue St NE
- 1755 127th Ave NE
- 1762 127th Ave NE
- 12670 Hastings St NE
- 12655 Goodhue St NE
- 1843 127th Ave NE
- 12662 Goodhue St NE
- 12652 Hastings St NE
- 12689 Hastings St NE
- 1743 127th Ave NE
- 12671 Hastings St NE
- 12637 Goodhue St NE
- 1738 127th Ave NE