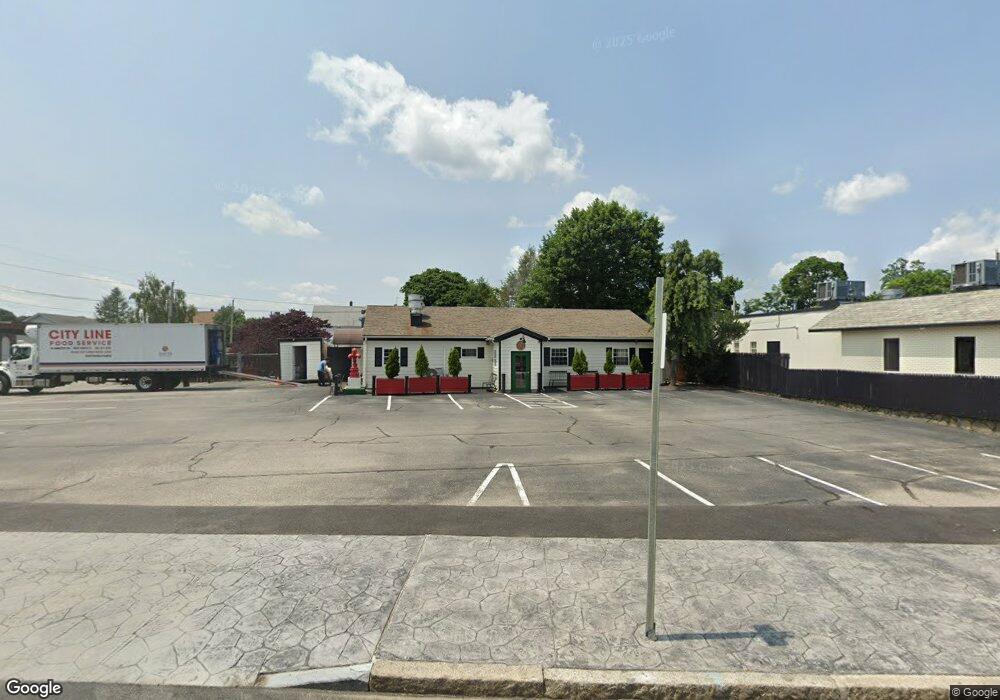
1791 Cranston St Cranston, RI 02920
Knightsville NeighborhoodEstimated Value: $534,196
Studio
--
Bath
1,540
Sq Ft
$347/Sq Ft
Est. Value
About This Home
This home is located at 1791 Cranston St, Cranston, RI 02920 and is currently estimated at $534,196, approximately $346 per square foot. 1791 Cranston St is a home located in Providence County with nearby schools including George J. Peters School, Western Hills Middle School, and Cranston High School West.
Ownership History
Date
Name
Owned For
Owner Type
Purchase Details
Closed on
Aug 26, 2021
Sold by
Testa Ft
Bought by
Forza Properties Llc
Current Estimated Value
Purchase Details
Closed on
Jun 29, 2018
Sold by
Moe Llc
Bought by
Mangia Bar Llc
Purchase Details
Closed on
Jun 17, 2015
Sold by
Kkc Realty Inc
Bought by
Moe Llc
Home Financials for this Owner
Home Financials are based on the most recent Mortgage that was taken out on this home.
Original Mortgage
$225,000
Interest Rate
3.78%
Mortgage Type
Commercial
Purchase Details
Closed on
Jan 7, 2008
Sold by
Tomasett Joseph and Tomasett Donna
Bought by
Kkc Realty Inc
Purchase Details
Closed on
Jan 28, 2005
Sold by
Lee-Mac Inc
Bought by
Tomaselli Joseph and Tomaselli Donna
Home Financials for this Owner
Home Financials are based on the most recent Mortgage that was taken out on this home.
Original Mortgage
$203,000
Interest Rate
5.67%
Mortgage Type
Commercial
Purchase Details
Closed on
Oct 17, 1997
Sold by
Mancini Fred
Bought by
Lee Mac Inc
Home Financials for this Owner
Home Financials are based on the most recent Mortgage that was taken out on this home.
Original Mortgage
$200,000
Interest Rate
7.46%
Mortgage Type
Commercial
Create a Home Valuation Report for This Property
The Home Valuation Report is an in-depth analysis detailing your home's value as well as a comparison with similar homes in the area
Home Values in the Area
Average Home Value in this Area
Purchase History
| Date | Buyer | Sale Price | Title Company |
|---|---|---|---|
| Forza Properties Llc | $825,000 | None Available | |
| Mangia Bar Llc | $300,000 | -- | |
| Moe Llc | $300,000 | -- | |
| Kkc Realty Inc | $315,000 | -- | |
| Tomaselli Joseph | $290,000 | -- | |
| Lee Mac Inc | $110,000 | -- |
Source: Public Records
Mortgage History
| Date | Status | Borrower | Loan Amount |
|---|---|---|---|
| Previous Owner | Lee Mac Inc | $225,000 | |
| Previous Owner | Lee Mac Inc | $203,000 | |
| Previous Owner | Lee Mac Inc | $200,000 |
Source: Public Records
Tax History Compared to Growth
Tax History
| Year | Tax Paid | Tax Assessment Tax Assessment Total Assessment is a certain percentage of the fair market value that is determined by local assessors to be the total taxable value of land and additions on the property. | Land | Improvement |
|---|---|---|---|---|
| 2025 | $6,964 | $334,500 | $100,700 | $233,800 |
| 2024 | $6,830 | $334,500 | $100,700 | $233,800 |
| 2023 | $7,524 | $265,400 | $86,300 | $179,100 |
| 2022 | $7,370 | $265,400 | $86,300 | $179,100 |
| 2021 | $7,166 | $265,400 | $86,300 | $179,100 |
| 2020 | $7,806 | $250,500 | $93,100 | $157,400 |
| 2019 | $7,806 | $250,500 | $93,100 | $157,400 |
| 2018 | $7,625 | $250,500 | $93,100 | $157,400 |
| 2017 | $9,160 | $266,200 | $84,600 | $181,600 |
| 2016 | $8,966 | $266,200 | $84,600 | $181,600 |
| 2015 | $8,966 | $266,200 | $84,600 | $181,600 |
| 2014 | -- | $260,400 | $84,600 | $175,800 |
Source: Public Records
Map
Nearby Homes
- 84 N View Ave
- 210 Hyde St
- 99 Salem Ave
- 54 Salem Ave
- 86 Sherwood St
- 111 Belgium St
- 19 Salem Ave
- 71 Norton Ave
- 0 Rutland St
- 14 New Hampshire St
- 38 Brettonwoods Dr
- 1574 Cranston St
- 321 Budlong Rd
- 00 Burton St
- 370 Budlong Rd
- 9 Southern St
- 46 Roslyn Ave
- 135 Meshanticut Valley Pkwy
- 446 Budlong Rd
- 93 Elena St
- 1785 Cranston St
- 19 Vervena St
- 1801 Cranston & 14 Vervena St
- 1801 Cranston St
- 1798 Cranston St
- 14 Vervena St
- 28 Bolton St
- 1800 Cranston St
- 1651 Cranston St
- 1111 Cranston St
- 1459 Cranston St
- 1659 Cranston St
- 27 Vervena St
- 1809 Cranston St
- 1809 Cranston St Unit 2
- 26 Vervena St
- 17 Bolton St
- 1769 Cranston St
- 36 Bolton St
- 31 Vervena St