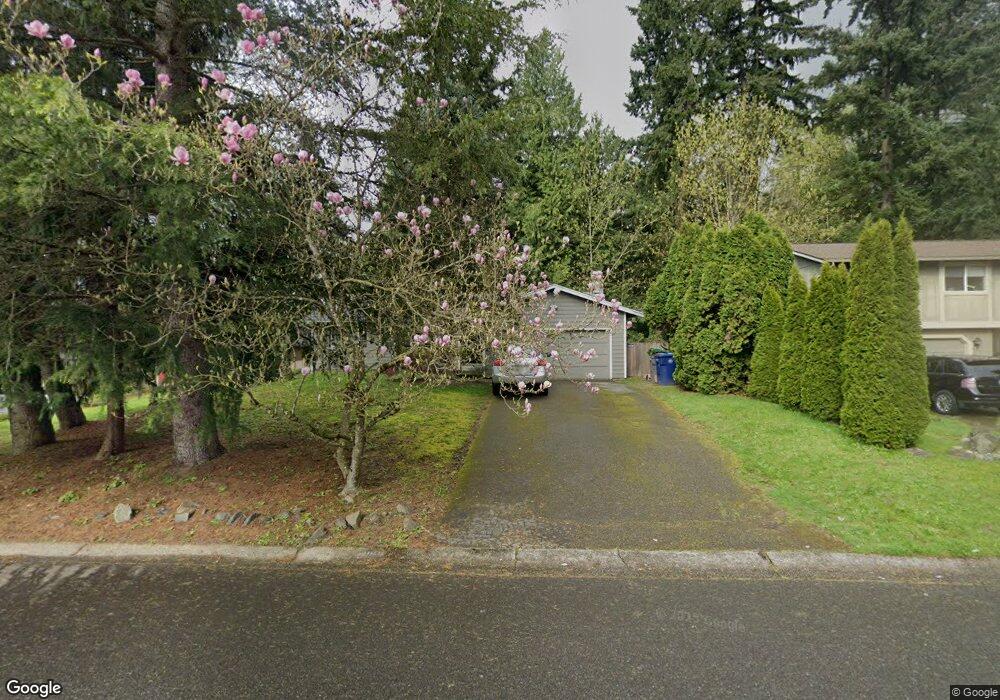
17912 25th Dr SE Bothell, WA 98012
North Creek NeighborhoodEstimated Value: $779,448 - $869,000
3
Beds
2
Baths
1,670
Sq Ft
$497/Sq Ft
Est. Value
About This Home
This home is located at 17912 25th Dr SE, Bothell, WA 98012 and is currently estimated at $829,362, approximately $496 per square foot. 17912 25th Dr SE is a home located in Snohomish County with nearby schools including Woodside Elementary School, Heatherwood Middle School, and Henry M. Jackson High School.
Ownership History
Date
Name
Owned For
Owner Type
Purchase Details
Closed on
Apr 8, 2013
Sold by
James Lisa
Bought by
James Lisa and James Jeff
Current Estimated Value
Purchase Details
Closed on
Feb 24, 2003
Sold by
Wheadon Richard A and Wheadon Jennifer
Bought by
Mangan James E
Home Financials for this Owner
Home Financials are based on the most recent Mortgage that was taken out on this home.
Original Mortgage
$191,200
Outstanding Balance
$78,062
Interest Rate
5.93%
Estimated Equity
$751,300
Purchase Details
Closed on
Jan 24, 2000
Sold by
Wheadon Jennifer D
Bought by
Wheadon Richard A
Home Financials for this Owner
Home Financials are based on the most recent Mortgage that was taken out on this home.
Original Mortgage
$188,446
Interest Rate
7.87%
Mortgage Type
FHA
Purchase Details
Closed on
Mar 2, 1997
Sold by
Leming Lowell Steven and Leming Gyda A
Bought by
Ginter Roy L
Home Financials for this Owner
Home Financials are based on the most recent Mortgage that was taken out on this home.
Original Mortgage
$110,000
Interest Rate
6%
Create a Home Valuation Report for This Property
The Home Valuation Report is an in-depth analysis detailing your home's value as well as a comparison with similar homes in the area
Home Values in the Area
Average Home Value in this Area
Purchase History
| Date | Buyer | Sale Price | Title Company |
|---|---|---|---|
| James Lisa | -- | None Available | |
| Mangan James E | $239,000 | Chicago | |
| Wheadon Richard A | -- | -- | |
| Wheadon Richard A | -- | -- | |
| Ginter Roy L | $158,950 | -- |
Source: Public Records
Mortgage History
| Date | Status | Borrower | Loan Amount |
|---|---|---|---|
| Open | Mangan James E | $191,200 | |
| Previous Owner | Wheadon Richard A | $188,446 | |
| Previous Owner | Ginter Roy L | $110,000 |
Source: Public Records
Tax History
| Year | Tax Paid | Tax Assessment Tax Assessment Total Assessment is a certain percentage of the fair market value that is determined by local assessors to be the total taxable value of land and additions on the property. | Land | Improvement |
|---|---|---|---|---|
| 2026 | $6,849 | $760,500 | $530,000 | $230,500 |
| 2025 | $6,388 | $707,400 | $495,000 | $212,400 |
| 2024 | $6,388 | $662,400 | $450,000 | $212,400 |
| 2023 | $6,786 | $772,300 | $525,000 | $247,300 |
| 2022 | $5,778 | $568,600 | $359,000 | $209,600 |
| 2020 | $5,692 | $471,000 | $287,000 | $184,000 |
| 2019 | $5,486 | $455,500 | $260,000 | $195,500 |
| 2018 | $5,282 | $399,400 | $225,000 | $174,400 |
| 2017 | $4,609 | $350,400 | $187,000 | $163,400 |
| 2016 | $4,023 | $320,900 | $164,000 | $156,900 |
| 2015 | $3,815 | $288,100 | $160,000 | $128,100 |
| 2013 | $3,358 | $223,900 | $120,000 | $103,900 |
Source: Public Records
Map
Nearby Homes
- 18309 26th Dr SE
- 17529 Brook Blvd
- 2401 185th Place SE
- 18501 28th Ave SE
- 18429 20th Dr SE
- 3205 179th Place SE
- 18223 31st Ave SE
- 3028 183rd Place SE
- 18632 29th Ave SE
- 1815 172nd St SE
- 18115 34th Dr SE
- 3414 176th Place SE
- 18809 20th Dr SE
- 17001 31st Dr SE
- 19102 20th Dr SE Unit B204
- 19102 20th Dr SE Unit B202
- 19102 20th Dr SE Unit B206
- 2502 166th Place SE
- 1516 170th Place SE
- 18910 Bothell Everett Hwy Unit H2
- 17904 25th Dr SE
- 17918 25th Dr SE
- 17830 25th Dr SE
- 17907 25th Dr SE
- 17915 25th Dr SE
- 17833 25th Dr SE
- 17824 25th Dr SE
- 17929 25th Dr SE
- 17827 25th Dr SE
- 2523 179th St SE Unit 18
- 2533 179th St SE Unit 16
- 2409 180th St SE
- 2527 179th St SE Unit 17
- 17816 25th Dr SE
- 17821 25th Dr SE
- 2305 180th St SE
- 17808 25th Dr SE
- 2525 180th Place SE
- 2522 178th St SE
Your Personal Tour Guide
Ask me questions while you tour the home.