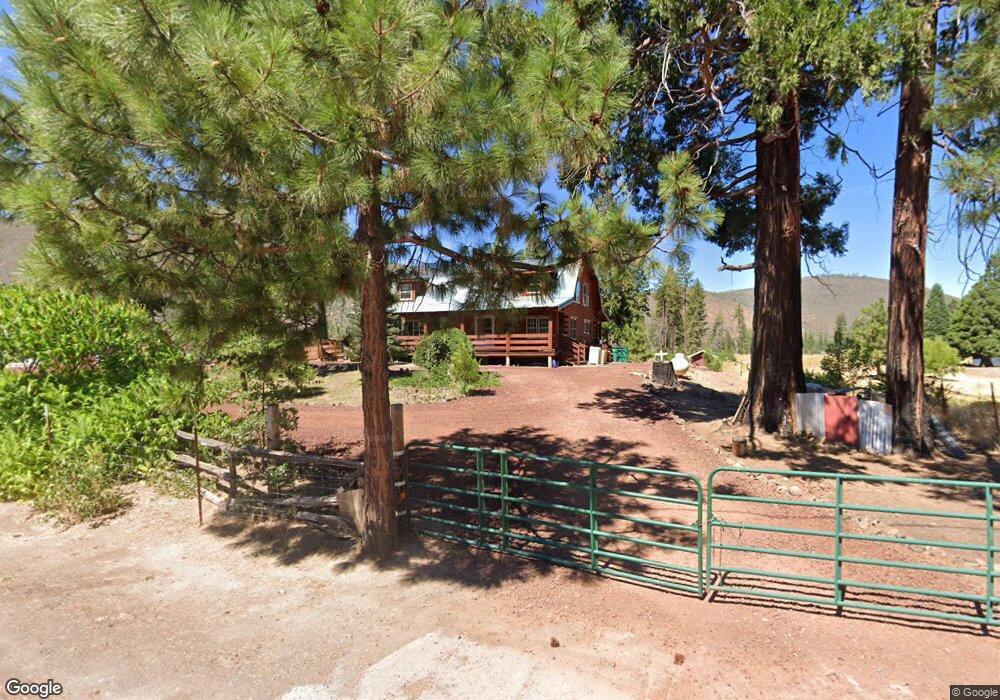
17912 Doty Rd Hat Creek, CA 96040
Estimated Value: $328,090 - $556,000
3
Beds
2
Baths
1,840
Sq Ft
$245/Sq Ft
Est. Value
About This Home
This home is located at 17912 Doty Rd, Hat Creek, CA 96040 and is currently estimated at $451,023, approximately $245 per square foot. 17912 Doty Rd is a home located in Shasta County with nearby schools including Fall River Elementary School and Fall River Junior/Senior High School.
Ownership History
Date
Name
Owned For
Owner Type
Purchase Details
Closed on
Sep 12, 2011
Sold by
Robinson Julie G
Bought by
Eulner Francis E and Eulner Barbara F
Current Estimated Value
Home Financials for this Owner
Home Financials are based on the most recent Mortgage that was taken out on this home.
Original Mortgage
$184,000
Outstanding Balance
$126,002
Interest Rate
4.26%
Mortgage Type
New Conventional
Estimated Equity
$325,021
Purchase Details
Closed on
Jun 3, 2011
Sold by
Thompson Julie G
Bought by
Robinson Julie G
Purchase Details
Closed on
Mar 26, 2008
Sold by
Thompson Julie
Bought by
Thompson Julie G
Purchase Details
Closed on
Feb 7, 2008
Sold by
Thompson Julie and Thompson Charles
Bought by
Thompson Julie
Create a Home Valuation Report for This Property
The Home Valuation Report is an in-depth analysis detailing your home's value as well as a comparison with similar homes in the area
Home Values in the Area
Average Home Value in this Area
Purchase History
| Date | Buyer | Sale Price | Title Company |
|---|---|---|---|
| Eulner Francis E | $230,000 | Placer Title Company | |
| Robinson Julie G | -- | None Available | |
| Thompson Julie G | -- | None Available | |
| Thompson Julie | -- | None Available |
Source: Public Records
Mortgage History
| Date | Status | Borrower | Loan Amount |
|---|---|---|---|
| Open | Eulner Francis E | $184,000 |
Source: Public Records
Tax History Compared to Growth
Tax History
| Year | Tax Paid | Tax Assessment Tax Assessment Total Assessment is a certain percentage of the fair market value that is determined by local assessors to be the total taxable value of land and additions on the property. | Land | Improvement |
|---|---|---|---|---|
| 2025 | $3,151 | $296,104 | $50,235 | $245,869 |
| 2024 | $3,108 | $290,299 | $49,250 | $241,049 |
| 2023 | $3,108 | $284,608 | $48,285 | $236,323 |
| 2022 | $3,019 | $279,029 | $47,339 | $231,690 |
| 2021 | $2,952 | $273,559 | $46,411 | $227,148 |
| 2020 | $2,943 | $270,755 | $45,936 | $224,819 |
| 2019 | $2,828 | $265,447 | $45,036 | $220,411 |
| 2018 | $2,475 | $218,668 | $44,153 | $174,515 |
| 2017 | $2,349 | $214,382 | $43,288 | $171,094 |
| 2016 | $2,280 | $210,180 | $42,440 | $167,740 |
| 2015 | $2,234 | $207,024 | $41,803 | $165,221 |
| 2014 | $236 | $235,664 | $40,985 | $194,679 |
Source: Public Records
Map
Nearby Homes
- 41406 Lonquist Ln
- 18573 California 89
- 18598 California 89
- 18826 V Ln N
- 40443 Volcano Ln
- 42048 Wilcox Rd
- 19845 Cinder Pit Rd
- 21151 Ridge Rd
- 21652 Rattlebush Dr
- 40015 Lava Ct
- 21726 Cassel Rd
- 21718 Cassel Rd
- 20158 Mapleleaf St
- 20174 Mapleleaf St
- 011 Kirby Ct
- 007 Kirby Ct
- 010 Kirby Ct
- 20194 Sugar Pine St
- 20244 Arrowood St
- 20227 Sugar Pine St
- 17950 Doty Rd
- 17949 Doty Rd
- 17976 Doty Rd
- 17830 Doty Rd
- 17806 Doty Rd
- 41406 Lonquist 1weup7n136y3
- 18047 Doty Rd
- 12 Acres California 89
- 16691 California 89
- 0 California 89
- 6.5 Acres California 89
- 17715 California 89
- 17715 State Highway 89
- 1 Doty Rd
- 18320 Hwy 89
- 18320 State Highway 89
- 41296 Opdyke Ln
- 18358 State Highway 89
- 18386 State Highway 89
- 41443 Bidwell Rd