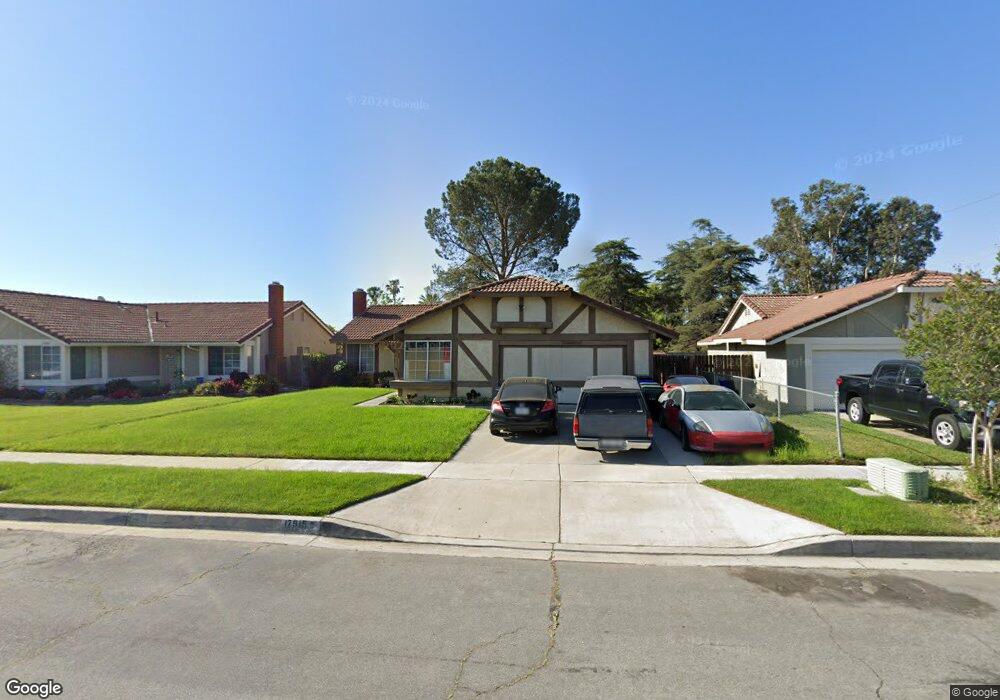
17915 San Jacinto Ave Fontana, CA 92336
Estimated Value: $545,833 - $601,000
3
Beds
2
Baths
1,104
Sq Ft
$519/Sq Ft
Est. Value
About This Home
This home is located at 17915 San Jacinto Ave, Fontana, CA 92336 and is currently estimated at $573,458, approximately $519 per square foot. 17915 San Jacinto Ave is a home located in San Bernardino County with nearby schools including Locust Elementary School, Alder Middle School, and Fontana A. B. Miller High School.
Ownership History
Date
Name
Owned For
Owner Type
Purchase Details
Closed on
May 4, 2004
Sold by
Quintana Peter Horacio and Quintana Gloria
Bought by
Quintana Peter Horacio and Quintana Gloria
Current Estimated Value
Purchase Details
Closed on
Jul 16, 1996
Sold by
Hud
Bought by
Quintana Pedro and Quintana Gloria
Home Financials for this Owner
Home Financials are based on the most recent Mortgage that was taken out on this home.
Original Mortgage
$89,441
Outstanding Balance
$6,570
Interest Rate
8.42%
Mortgage Type
FHA
Estimated Equity
$566,888
Purchase Details
Closed on
Apr 3, 1995
Sold by
Ellis Ronald R and Ellis Sandra L
Bought by
Barclaysamerican/Mtg Corp
Purchase Details
Closed on
Mar 23, 1995
Sold by
Barclaysamerican/Mtg Corp
Bought by
Hud
Create a Home Valuation Report for This Property
The Home Valuation Report is an in-depth analysis detailing your home's value as well as a comparison with similar homes in the area
Home Values in the Area
Average Home Value in this Area
Purchase History
| Date | Buyer | Sale Price | Title Company |
|---|---|---|---|
| Quintana Peter Horacio | -- | Gateway Title Company | |
| Quintana Pedro | $91,500 | First Southwestern Title Co | |
| Barclaysamerican/Mtg Corp | $143,454 | Stewart Title Co | |
| Hud | -- | American Title |
Source: Public Records
Mortgage History
| Date | Status | Borrower | Loan Amount |
|---|---|---|---|
| Open | Quintana Pedro | $89,441 |
Source: Public Records
Tax History Compared to Growth
Tax History
| Year | Tax Paid | Tax Assessment Tax Assessment Total Assessment is a certain percentage of the fair market value that is determined by local assessors to be the total taxable value of land and additions on the property. | Land | Improvement |
|---|---|---|---|---|
| 2025 | $2,259 | $148,405 | $43,977 | $104,428 |
| 2024 | $2,259 | $145,495 | $43,115 | $102,380 |
| 2023 | $1,841 | $142,643 | $42,270 | $100,373 |
| 2022 | $1,816 | $139,846 | $41,441 | $98,405 |
| 2021 | $1,789 | $137,103 | $40,628 | $96,475 |
| 2020 | $1,770 | $135,697 | $40,211 | $95,486 |
| 2019 | $1,726 | $133,037 | $39,423 | $93,614 |
| 2018 | $1,727 | $130,428 | $38,650 | $91,778 |
| 2017 | $1,691 | $127,870 | $37,892 | $89,978 |
| 2016 | $1,641 | $125,363 | $37,149 | $88,214 |
| 2015 | $1,604 | $123,480 | $36,591 | $86,889 |
| 2014 | $1,590 | $121,061 | $35,874 | $85,187 |
Source: Public Records
Map
Nearby Homes
- 7724 Myles Ct
- 17571 Shamrock Ave
- 17806 Terry St
- 7835 Laurel Ave
- 18281 Montgomery Ave
- 7398 N Maple Ave
- 7852 Grace Ave
- 7740 Lombardy Ave
- 7870 Williams Rd
- 956 N Sandalwood Ave
- 17548 Court St
- 17562 Court St
- 7936 Alder Ave
- 7925 Spohn Ave
- 645 N Maple Ave
- 17848 17858 Foothill Blvd
- 8019 Alder Ave
- 7738 Encinitas Ave
- 17341 Fairfax St
- 18045 Foothill Blvd
- 17925 San Jacinto Ave
- 17905 San Jacinto Ave
- 17935 San Jacinto Ave
- 7491 Laurel Ave
- 7430 Ferndale Ave
- 7435 Laurel Ave
- 17945 San Jacinto Ave
- 7470 Laurel Ave
- 7460 Laurel Ave
- 7420 Ferndale Ave
- 7425 Laurel Ave
- 17895 San Jacinto Ave
- 7435 Ferndale Ave
- 7450 Laurel Ave
- 17955 San Jacinto Ave
- 17885 San Jacinto Ave
- 7425 Ferndale Ave
- 7410 Ferndale Ave
- 7415 Laurel Ave
- 7440 Laurel Ave