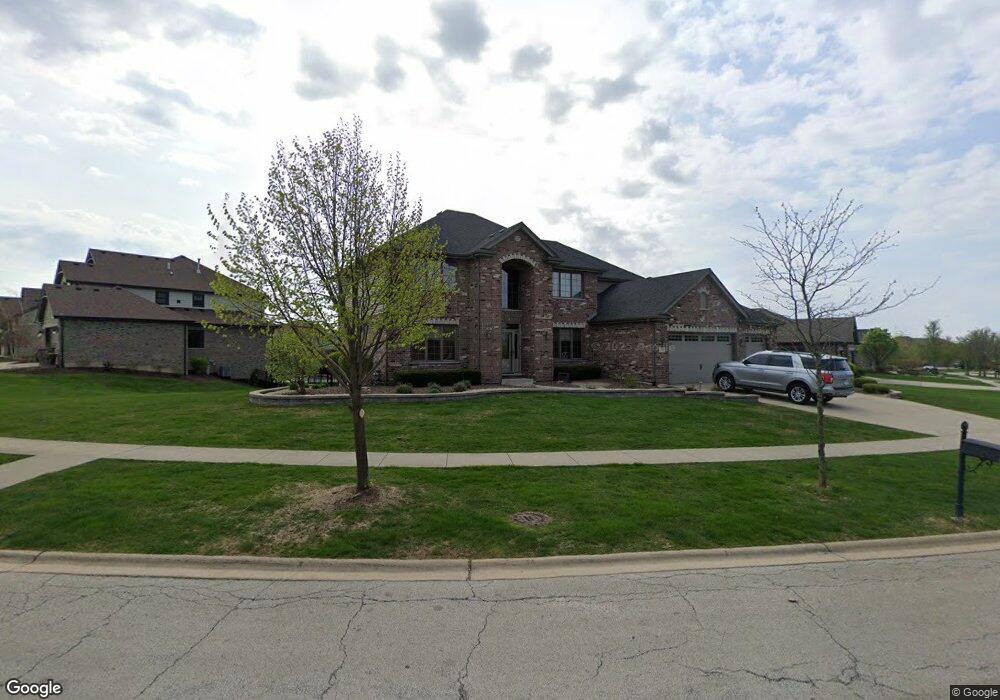
1792 Brogan Dr New Lenox, IL 60451
Estimated Value: $617,000 - $737,000
--
Bed
--
Bath
--
Sq Ft
0.36
Acres
About This Home
This home is located at 1792 Brogan Dr, New Lenox, IL 60451 and is currently estimated at $671,473. 1792 Brogan Dr is a home located in Will County with nearby schools including Spencer Trail, Spencer Pointe, and Spencer Crossing Intermediate School.
Ownership History
Date
Name
Owned For
Owner Type
Purchase Details
Closed on
Feb 9, 2022
Sold by
Wolfe Dana M
Bought by
Wolfe Nicholas R
Current Estimated Value
Home Financials for this Owner
Home Financials are based on the most recent Mortgage that was taken out on this home.
Original Mortgage
$355,700
Outstanding Balance
$331,085
Interest Rate
3.75%
Mortgage Type
New Conventional
Estimated Equity
$340,388
Purchase Details
Closed on
Jul 25, 2014
Sold by
Winslow Ventures Corporation
Bought by
Wolfe Nicholas R and Wolfe Dana M
Home Financials for this Owner
Home Financials are based on the most recent Mortgage that was taken out on this home.
Original Mortgage
$398,492
Interest Rate
5%
Mortgage Type
New Conventional
Purchase Details
Closed on
Mar 21, 2014
Sold by
Wieringa Ross J
Bought by
Winslow Ventures Corporation
Purchase Details
Closed on
Jul 29, 2013
Sold by
Chicago Title Land Trust Co
Bought by
Wieringa Ross J
Create a Home Valuation Report for This Property
The Home Valuation Report is an in-depth analysis detailing your home's value as well as a comparison with similar homes in the area
Home Values in the Area
Average Home Value in this Area
Purchase History
| Date | Buyer | Sale Price | Title Company |
|---|---|---|---|
| Wolfe Nicholas R | -- | Citywide Title | |
| Wolfe Nicholas R | $438,492 | Chicago Title Insurance Co | |
| Winslow Ventures Corporation | $420,000 | None Available | |
| Wieringa Ross J | $520,000 | None Available |
Source: Public Records
Mortgage History
| Date | Status | Borrower | Loan Amount |
|---|---|---|---|
| Open | Wolfe Nicholas R | $355,700 | |
| Previous Owner | Wolfe Nicholas R | $398,492 |
Source: Public Records
Tax History Compared to Growth
Tax History
| Year | Tax Paid | Tax Assessment Tax Assessment Total Assessment is a certain percentage of the fair market value that is determined by local assessors to be the total taxable value of land and additions on the property. | Land | Improvement |
|---|---|---|---|---|
| 2024 | $15,821 | $202,955 | $43,265 | $159,690 |
| 2023 | $15,821 | $185,009 | $39,439 | $145,570 |
| 2022 | $14,228 | $170,437 | $36,333 | $134,104 |
| 2021 | $13,522 | $160,291 | $34,170 | $126,121 |
| 2020 | $12,533 | $147,636 | $32,951 | $114,685 |
| 2019 | $12,002 | $143,058 | $31,929 | $111,129 |
| 2018 | $11,733 | $138,127 | $30,828 | $107,299 |
| 2017 | $11,154 | $134,156 | $29,942 | $104,214 |
| 2016 | $10,834 | $130,566 | $29,141 | $101,425 |
| 2015 | -- | $126,456 | $28,224 | $98,232 |
| 2014 | -- | $16,774 | $16,774 | $0 |
| 2013 | -- | $70 | $70 | $0 |
Source: Public Records
Map
Nearby Homes
- 1990 Edgeview Dr
- LOT 8 W Laraway Rd
- 2067 Edgeview Dr
- 2185 Bristol Park Rd
- 575 Caledonia Dr
- 911 Canongate Ln
- 13255 W Laraway Rd
- Raleigh Plan at Calistoga
- Siena II Plan at Calistoga
- Galveston Plan at Calistoga
- Brooklyn Plan at Calistoga
- Ontario Plan at Calistoga
- Westbury Plan at Calistoga
- 2231 Stone Creek Dr
- 2241 Stone Creek Dr
- 2251 Stone Creek Dr
- 2291 Stone Creek Dr
- 2301 Stone Creek Dr
- 2461 Stone Creek Dr
- 2451 Stone Creek Dr