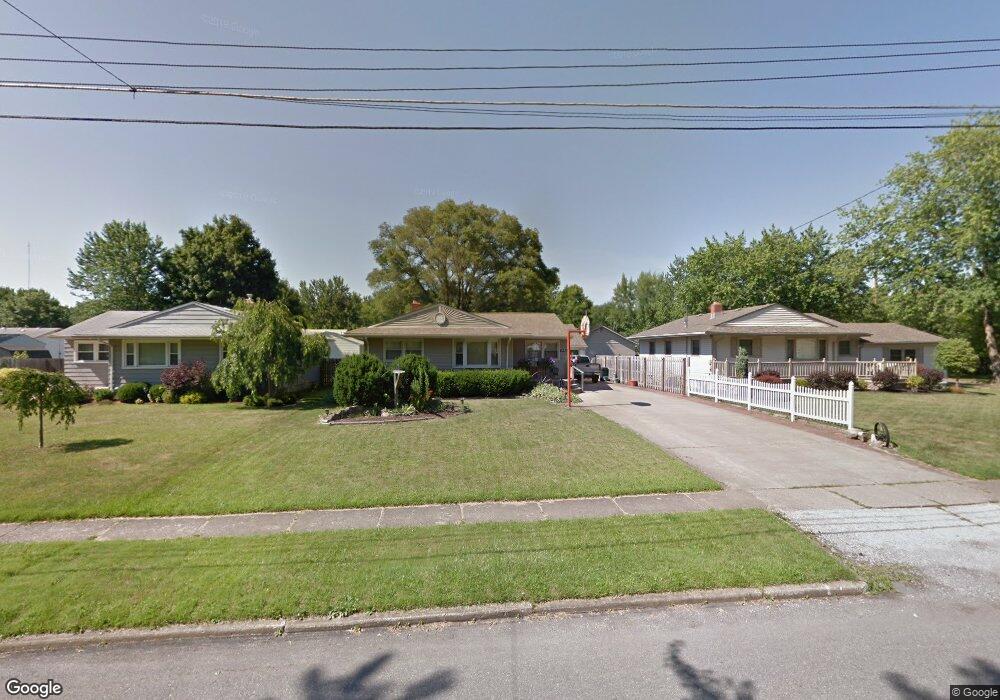
1792 Lealand Ave Youngstown, OH 44514
Estimated Value: $128,000 - $179,680
3
Beds
1
Bath
1,056
Sq Ft
$144/Sq Ft
Est. Value
About This Home
This home is located at 1792 Lealand Ave, Youngstown, OH 44514 and is currently estimated at $152,420, approximately $144 per square foot. 1792 Lealand Ave is a home located in Mahoning County with nearby schools including Poland Union Elementary School, Poland Middle School, and Poland Seminary High School.
Ownership History
Date
Name
Owned For
Owner Type
Purchase Details
Closed on
Nov 25, 2024
Sold by
Pangello Mary Lou and Ligore Mary Lou
Bought by
Morton Giovanni M
Current Estimated Value
Home Financials for this Owner
Home Financials are based on the most recent Mortgage that was taken out on this home.
Original Mortgage
$121,250
Outstanding Balance
$120,207
Interest Rate
6.32%
Mortgage Type
New Conventional
Estimated Equity
$32,213
Purchase Details
Closed on
Aug 24, 2022
Sold by
Ligore Mary Lou
Bought by
Pangello Anthony and Ligore Mary Lou
Purchase Details
Closed on
Mar 12, 2015
Sold by
Pangello Joseph A
Bought by
Pangello Mary Lou
Purchase Details
Closed on
Apr 15, 1968
Bought by
Pangello J L and M L
Create a Home Valuation Report for This Property
The Home Valuation Report is an in-depth analysis detailing your home's value as well as a comparison with similar homes in the area
Home Values in the Area
Average Home Value in this Area
Purchase History
| Date | Buyer | Sale Price | Title Company |
|---|---|---|---|
| Morton Giovanni M | $125,000 | None Listed On Document | |
| Morton Giovanni M | $125,000 | None Listed On Document | |
| Morton Giovanni M | $125,000 | None Listed On Document | |
| Pangello Anthony | -- | -- | |
| Pangello Mary Lou | -- | Attorney | |
| Pangello J L | -- | -- |
Source: Public Records
Mortgage History
| Date | Status | Borrower | Loan Amount |
|---|---|---|---|
| Open | Morton Giovanni M | $121,250 | |
| Closed | Morton Giovanni M | $121,250 |
Source: Public Records
Tax History Compared to Growth
Tax History
| Year | Tax Paid | Tax Assessment Tax Assessment Total Assessment is a certain percentage of the fair market value that is determined by local assessors to be the total taxable value of land and additions on the property. | Land | Improvement |
|---|---|---|---|---|
| 2024 | $2,143 | $50,900 | $5,460 | $45,440 |
| 2023 | $2,149 | $50,900 | $5,460 | $45,440 |
| 2022 | $1,576 | $34,000 | $5,270 | $28,730 |
| 2021 | $1,537 | $33,310 | $5,270 | $28,040 |
| 2020 | $1,543 | $33,310 | $5,270 | $28,040 |
| 2019 | $1,255 | $26,230 | $4,150 | $22,080 |
| 2018 | $1,142 | $26,230 | $4,150 | $22,080 |
| 2017 | $1,216 | $26,230 | $4,150 | $22,080 |
| 2016 | $1,312 | $28,440 | $6,110 | $22,330 |
| 2015 | $1,288 | $28,440 | $6,110 | $22,330 |
| 2014 | $1,856 | $28,440 | $6,110 | $22,330 |
| 2013 | $1,834 | $28,440 | $6,110 | $22,330 |
Source: Public Records
Map
Nearby Homes
- 1859 Mathews Rd
- 0 Mathews Rd Unit 5149232
- 0 Mathews Rd Unit 5143059
- 1894 Lealand Ave
- 1890 Mathews Rd
- 0 Oles Ave
- 1804 Alverne Dr
- 0 Woodlawn Ave
- 1827 Alverne Dr
- 1841 Wingate Rd
- 1738 Island Dr
- 2035 Woodward Ave
- 1919 Wingate Rd
- 5710 Youngstown Poland Rd
- 1828 Basil Ave
- 928 Edenridge Dr
- 34 Venloe Dr
- 43 Venloe Dr
- 2128 Lyon Blvd
- 2035 Holbrook Rd
- 1786 Lealand Ave
- 1798 Lealand Ave
- 1780 Lealand Ave
- 1793 Lynn Mar Ave
- 1799 Lynn Mar Ave
- 1789 Lynn Mar Ave
- 1793 Lealand Ave
- 1783 Lynn Mar Ave
- 1787 Lealand Ave
- 1799 Lealand Ave
- 1802 Lealand Ave
- 1776 Lealand Ave
- 1781 Lealand Ave
- 1777 Lynn Mar Ave
- 1803 Lynn Mar Ave
- 1770 Lealand Ave
- 1806 Lealand Ave
- 1801 Lealand Ave
- 1775 Lealand Ave
- 1771 Lynn Mar Ave