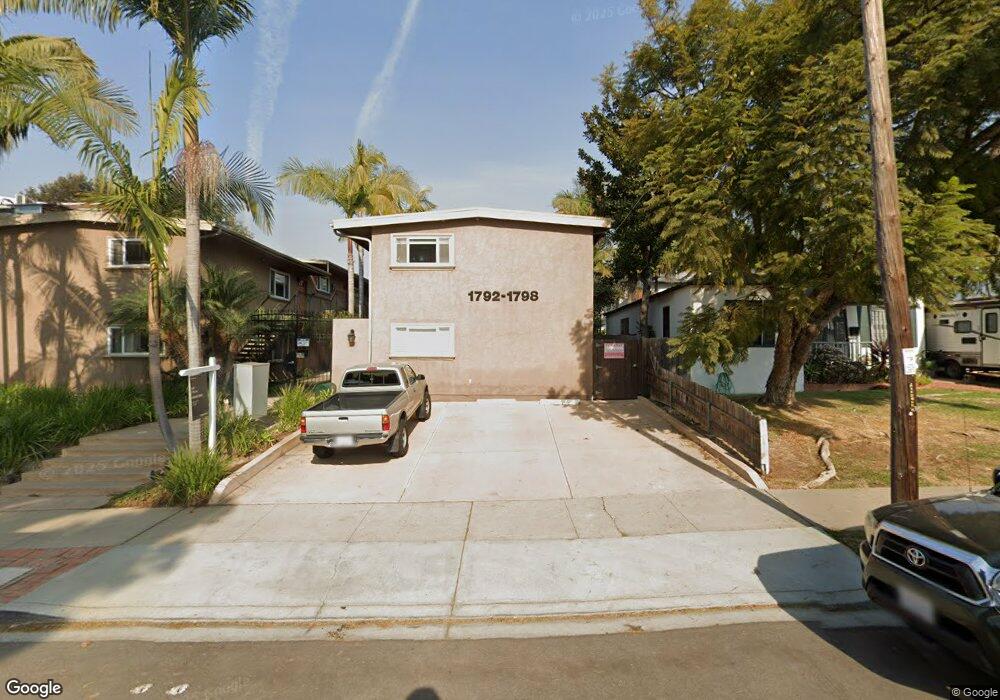
1792 Missouri St Unit 1 San Diego, CA 92109
Pacific Beach NeighborhoodEstimated Value: $562,000 - $792,000
2
Beds
1
Bath
726
Sq Ft
$887/Sq Ft
Est. Value
About This Home
This home is located at 1792 Missouri St Unit 1, San Diego, CA 92109 and is currently estimated at $644,085, approximately $887 per square foot. 1792 Missouri St Unit 1 is a home located in San Diego County with nearby schools including Sessions Elementary School, Pacific Beach Middle, and Mission Bay High School.
Ownership History
Date
Name
Owned For
Owner Type
Purchase Details
Closed on
Jul 25, 2023
Sold by
Kora Chang Trust
Bought by
Kora Walter Living Trust and Walter
Current Estimated Value
Purchase Details
Closed on
Jan 11, 2019
Sold by
Chang Kora
Bought by
Chang Kora and Kora Chang Trust
Purchase Details
Closed on
Oct 29, 2018
Sold by
Gillespie Kevin
Bought by
Chang Kora
Home Financials for this Owner
Home Financials are based on the most recent Mortgage that was taken out on this home.
Original Mortgage
$317,600
Interest Rate
4.37%
Mortgage Type
Adjustable Rate Mortgage/ARM
Purchase Details
Closed on
Aug 28, 2017
Sold by
Gillespie Gina
Bought by
Gillespie Kevin A
Purchase Details
Closed on
Dec 21, 2005
Sold by
1792 Missouri Llc
Bought by
Rockwell Karen
Home Financials for this Owner
Home Financials are based on the most recent Mortgage that was taken out on this home.
Original Mortgage
$220,000
Interest Rate
5.75%
Mortgage Type
Fannie Mae Freddie Mac
Create a Home Valuation Report for This Property
The Home Valuation Report is an in-depth analysis detailing your home's value as well as a comparison with similar homes in the area
Home Values in the Area
Average Home Value in this Area
Purchase History
| Date | Buyer | Sale Price | Title Company |
|---|---|---|---|
| Kora Walter Living Trust | -- | None Listed On Document | |
| Chang Kora | -- | Chicago Title Company | |
| Chang Kora | $397,000 | Chicago Title Company | |
| Gillespie Kevin A | -- | Chicago Title Company | |
| Gillespie Kevin A | $376,000 | Chicago Title Company | |
| Rockwell Karen | $370,000 | First American Title |
Source: Public Records
Mortgage History
| Date | Status | Borrower | Loan Amount |
|---|---|---|---|
| Previous Owner | Chang Kora | $317,600 | |
| Previous Owner | Rockwell Karen | $220,000 |
Source: Public Records
Tax History Compared to Growth
Tax History
| Year | Tax Paid | Tax Assessment Tax Assessment Total Assessment is a certain percentage of the fair market value that is determined by local assessors to be the total taxable value of land and additions on the property. | Land | Improvement |
|---|---|---|---|---|
| 2025 | $5,364 | $442,855 | $324,761 | $118,094 |
| 2024 | $5,364 | $434,173 | $318,394 | $115,779 |
| 2023 | $5,246 | $425,660 | $312,151 | $113,509 |
| 2022 | $5,106 | $417,315 | $306,031 | $111,284 |
| 2021 | $5,072 | $409,133 | $300,031 | $109,102 |
| 2020 | $5,010 | $404,939 | $296,955 | $107,984 |
| 2019 | $4,921 | $397,000 | $291,133 | $105,867 |
| 2018 | $4,447 | $376,000 | $275,733 | $100,267 |
| 2017 | $80 | $360,000 | $264,000 | $96,000 |
| 2016 | $3,903 | $330,000 | $242,000 | $88,000 |
| 2015 | $3,845 | $325,000 | $239,000 | $86,000 |
| 2014 | $3,566 | $300,000 | $221,000 | $79,000 |
Source: Public Records
Map
Nearby Homes
- 4804 Lamont St
- 1828 Diamond St Unit 3
- 4600 Lamont St Unit 4-103
- 1713 Missouri St
- 1885 Diamond St Unit 133
- 1885 Diamond St Unit 2-235
- 1885 Diamond St Unit 2-234
- 1885 Diamond St Unit 310
- 1855 Diamond St Unit 201
- 1775 Diamond St Unit 220
- 1855 Diamond St Unit 5-309
- 1855 Diamond St Unit 228
- 1679-81 Chalcedony St
- 2002 Missouri St Unit 6
- 2020 Diamond St Unit 12
- 1643 Missouri St Unit U2
- 1978 Beryl St
- 4750 Noyes St Unit 110
- 4964 Kendall St
- 1981 Wilbur Ave
- 1792 Missouri St Unit 6
- 1792 Missouri St Unit 4
- 1792 Missouri St Unit 9
- 1792 Missouri St Unit 7
- 1792 Missouri St
- 1792 Missouri St Unit 2
- 1792 Missouri St Unit 5
- 1792 Missouri St Unit 10
- 1792 Missouri St Unit 98
- 1792 Missouri St Unit 98
- 1792 Missouri St Unit 98
- 1798 Missouri St Unit 12
- 1798 Missouri St Unit 11
- 1798 Missouri St Unit 8
- 1798 Missouri St Unit 9
- 1798 Missouri St Unit 10
- 1792 Missouri St Unit 12
- 1804 Missouri St Unit 6
- 1790 Missouri St Unit B
- 1790 Missouri St Unit A