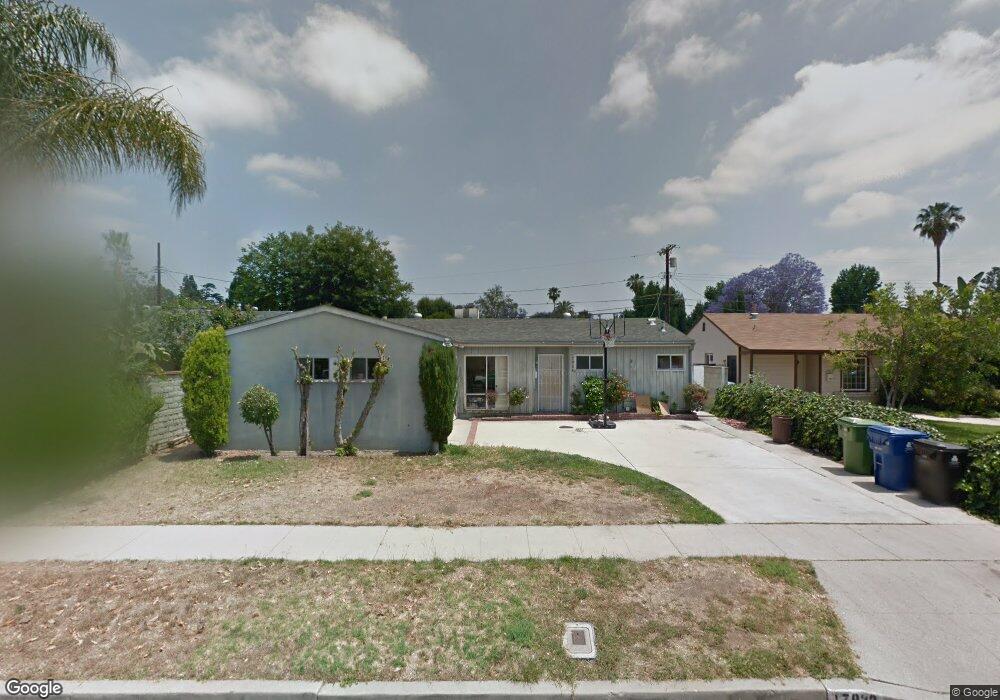
17928 Hemmingway St Reseda, CA 91335
Estimated Value: $769,164 - $977,000
4
Beds
2
Baths
1,200
Sq Ft
$728/Sq Ft
Est. Value
About This Home
This home is located at 17928 Hemmingway St, Reseda, CA 91335 and is currently estimated at $873,291, approximately $727 per square foot. 17928 Hemmingway St is a home located in Los Angeles County with nearby schools including Anatola Avenue Elementary School, Northridge Middle School, and Northridge Academy High.
Ownership History
Date
Name
Owned For
Owner Type
Purchase Details
Closed on
Apr 2, 2013
Sold by
Roney Alan E and Roney Maria E
Bought by
Roney Alan E and Roney Maria E
Current Estimated Value
Home Financials for this Owner
Home Financials are based on the most recent Mortgage that was taken out on this home.
Original Mortgage
$158,500
Outstanding Balance
$33,612
Interest Rate
3.54%
Mortgage Type
New Conventional
Estimated Equity
$839,679
Purchase Details
Closed on
Mar 27, 2000
Sold by
Garland Josephine and Lauratis Joanne R
Bought by
Roney Alan E and Haro Maria E
Home Financials for this Owner
Home Financials are based on the most recent Mortgage that was taken out on this home.
Original Mortgage
$166,500
Interest Rate
8.38%
Purchase Details
Closed on
Jun 26, 1997
Sold by
Ventresca Josephine and Garland Josephine
Bought by
Garland Josephine and Lauratis Joanne R
Purchase Details
Closed on
Oct 28, 1996
Sold by
Garland Sanford L
Bought by
Garland Josephine
Create a Home Valuation Report for This Property
The Home Valuation Report is an in-depth analysis detailing your home's value as well as a comparison with similar homes in the area
Home Values in the Area
Average Home Value in this Area
Purchase History
| Date | Buyer | Sale Price | Title Company |
|---|---|---|---|
| Roney Alan E | -- | Lsi Title Company | |
| Roney Alan E | $185,000 | Equity Title | |
| Garland Josephine | -- | -- | |
| Garland Josephine | -- | -- |
Source: Public Records
Mortgage History
| Date | Status | Borrower | Loan Amount |
|---|---|---|---|
| Open | Roney Alan E | $158,500 | |
| Closed | Roney Alan E | $166,500 |
Source: Public Records
Tax History Compared to Growth
Tax History
| Year | Tax Paid | Tax Assessment Tax Assessment Total Assessment is a certain percentage of the fair market value that is determined by local assessors to be the total taxable value of land and additions on the property. | Land | Improvement |
|---|---|---|---|---|
| 2025 | $6,621 | $284,315 | $184,580 | $99,735 |
| 2024 | $6,621 | $278,741 | $180,961 | $97,780 |
| 2023 | $6,554 | $273,276 | $177,413 | $95,863 |
| 2022 | $6,386 | $267,919 | $173,935 | $93,984 |
| 2021 | $6,341 | $262,667 | $170,525 | $92,142 |
| 2019 | $6,244 | $254,878 | $165,468 | $89,410 |
| 2018 | $6,157 | $249,881 | $162,224 | $87,657 |
| 2016 | $2,910 | $240,180 | $155,926 | $84,254 |
| 2015 | $2,868 | $236,573 | $153,584 | $82,989 |
| 2014 | $2,884 | $231,940 | $150,576 | $81,364 |
Source: Public Records
Map
Nearby Homes
- 7848 Chastain Ave
- 7927 Chastain Place
- 17751 Stagg St
- 18003 Saticoy St
- 7732 Garden Grove Ave
- 7719 Nestle Ave
- 7512 Jamieson Ave
- 8045 Garden Grove Ave
- 7445 Balcom Ave
- 7412 Jamieson Ave
- 18352 Keswick St Unit 2
- 7434 Nestle Ave
- 18347 Saticoy St Unit 17
- 18347 Saticoy St Unit 37
- 8051 Etiwanda Ave
- 8132 White Oak Ave
- 7320 Newcastle Ave
- 7322 Lindley Ave
- 7316 Lindley Ave
- 8223 Garden Grove Ave
- 17934 Hemmingway St
- 17922 Hemmingway St
- 17925 Keswick St
- 17921 Keswick St
- 17940 Hemmingway St
- 17916 Hemmingway St
- 17931 Keswick St
- 17915 Keswick St
- 17927 Hemmingway St
- 17937 Keswick St
- 17933 Hemmingway St
- 17921 Hemmingway St
- 17946 Hemmingway St
- 17910 Hemmingway St
- 17939 Hemmingway St
- 17915 Hemmingway St
- 17909 Keswick St
- 17945 Keswick St
- 17945 Hemmingway St
- 17952 Hemmingway St