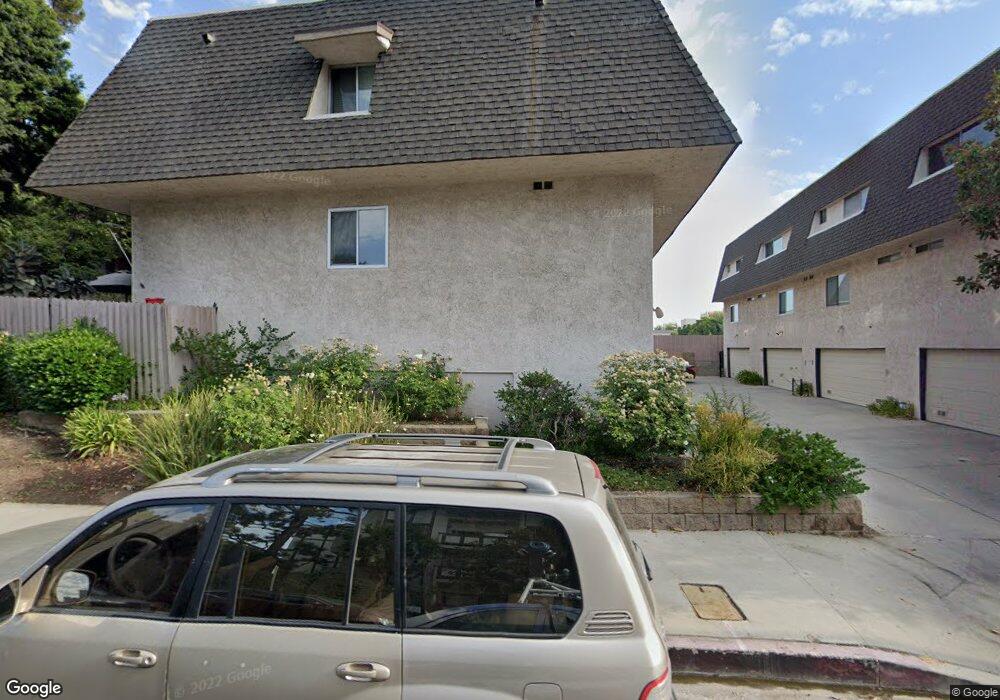
17937 Magnolia Blvd Unit 19 Encino, CA 91316
Estimated Value: $614,000 - $646,000
2
Beds
3
Baths
1,451
Sq Ft
$437/Sq Ft
Est. Value
About This Home
This home is located at 17937 Magnolia Blvd Unit 19, Encino, CA 91316 and is currently estimated at $634,125, approximately $437 per square foot. 17937 Magnolia Blvd Unit 19 is a home located in Los Angeles County with nearby schools including Gaspar De Portola Middle School, Nestle Avenue Charter, and Emelita Street Elementary.
Ownership History
Date
Name
Owned For
Owner Type
Purchase Details
Closed on
Jun 23, 2003
Sold by
Moskowitz Bruce and Moskowitz Nadine
Bought by
Moskowitz Bruce M
Current Estimated Value
Purchase Details
Closed on
Apr 11, 2003
Sold by
Wosk Leonard J and Wosk Pamela Gwen
Bought by
Moskowitz Bruce
Home Financials for this Owner
Home Financials are based on the most recent Mortgage that was taken out on this home.
Original Mortgage
$199,000
Interest Rate
5.71%
Mortgage Type
Purchase Money Mortgage
Purchase Details
Closed on
Apr 30, 2001
Sold by
Wosk Leonard J
Bought by
Wosk Leonard J
Purchase Details
Closed on
Dec 13, 1993
Sold by
Wosk Leonard J and Wosk Pamela
Bought by
Wosk Leonard J
Home Financials for this Owner
Home Financials are based on the most recent Mortgage that was taken out on this home.
Original Mortgage
$155,000
Interest Rate
7.09%
Create a Home Valuation Report for This Property
The Home Valuation Report is an in-depth analysis detailing your home's value as well as a comparison with similar homes in the area
Home Values in the Area
Average Home Value in this Area
Purchase History
| Date | Buyer | Sale Price | Title Company |
|---|---|---|---|
| Moskowitz Bruce M | -- | -- | |
| Moskowitz Bruce | $299,000 | Equity Title | |
| Wosk Leonard J | -- | Equity Title | |
| Wosk Leonard J | -- | Old Republic Title Company |
Source: Public Records
Mortgage History
| Date | Status | Borrower | Loan Amount |
|---|---|---|---|
| Previous Owner | Moskowitz Bruce | $199,000 | |
| Previous Owner | Wosk Leonard J | $155,000 |
Source: Public Records
Tax History Compared to Growth
Tax History
| Year | Tax Paid | Tax Assessment Tax Assessment Total Assessment is a certain percentage of the fair market value that is determined by local assessors to be the total taxable value of land and additions on the property. | Land | Improvement |
|---|---|---|---|---|
| 2025 | $5,288 | $433,031 | $281,691 | $151,340 |
| 2024 | $5,288 | $424,541 | $276,168 | $148,373 |
| 2023 | $5,187 | $416,217 | $270,753 | $145,464 |
| 2022 | $4,945 | $408,057 | $265,445 | $142,612 |
| 2021 | $4,880 | $400,057 | $260,241 | $139,816 |
| 2019 | $4,733 | $388,193 | $252,523 | $135,670 |
| 2018 | $4,697 | $380,582 | $247,572 | $133,010 |
| 2016 | $4,479 | $365,805 | $237,959 | $127,846 |
| 2015 | $4,415 | $360,311 | $234,385 | $125,926 |
| 2014 | $4,434 | $353,254 | $229,794 | $123,460 |
Source: Public Records
Map
Nearby Homes
- 17914 Magnolia Blvd Unit 127
- 17914 Magnolia Blvd Unit 204
- 17914 Magnolia Blvd Unit 125
- 17914 Magnolia Blvd Unit 135
- 5135 Zelzah Ave Unit 203
- 5142 Zelzah Ave Unit 25
- 5325 Newcastle Ave Unit 108
- 5325 Newcastle Ave Unit 319
- 5325 Newcastle Ave Unit 328
- 5325 Newcastle Ave Unit 327
- 5325 Newcastle Ave Unit 223
- 5325 Newcastle Ave Unit 127
- 5250 Zelzah Ave Unit 12A
- 5230 Zelzah Ave Unit 3
- 5315 Zelzah Ave Unit 6
- 5328 Newcastle Ave Unit 58
- 5310 Zelzah Ave Unit 305
- 5310 Zelzah Ave Unit 312
- 5310 Zelzah Ave Unit 302
- 5339 Newcastle Ave Unit 112
- 17937 Magnolia Blvd
- 17937 Magnolia Blvd
- 17931 Magnolia Blvd Unit 22
- 17931 Magnolia Blvd Unit 21
- 17937 Magnolia Blvd Unit 20
- 17937 Magnolia Blvd Unit 18
- 17937 Magnolia Blvd Unit 17
- 17949 Magnolia Blvd Unit 12
- 17949 Magnolia Blvd Unit 11
- 17949 Magnolia Blvd Unit 10
- 17949 Magnolia Blvd Unit 9
- 17955 Magnolia Blvd Unit 8
- 17955 Magnolia Blvd Unit 7
- 17931 Magnolia Blvd Unit 23
- 17955 Magnolia Blvd Unit 6
- 17955 Magnolia Blvd Unit 5
- 5240 Newcastle Ave Unit 4
- 5238 Newcastle Ave Unit 3
- 5236 Newcastle Ave Unit 2
- 17943 Magnolia Blvd Unit 16