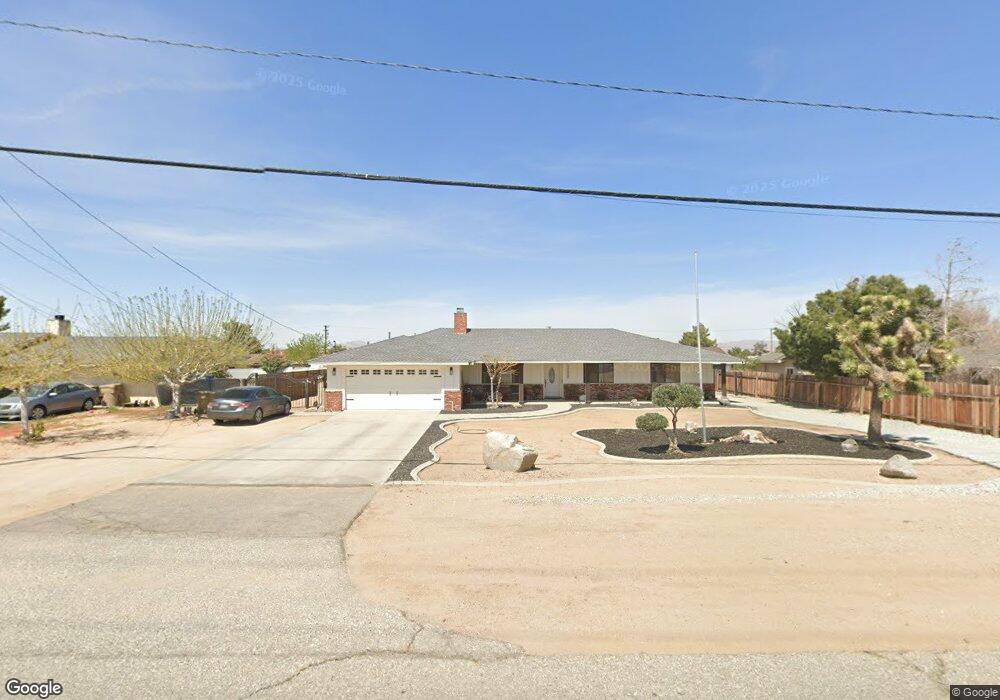
17938 Walnut St Hesperia, CA 92345
The Mesa NeighborhoodEstimated Value: $431,197 - $475,000
About This Home
This home is located at 17938 Walnut St, Hesperia, CA 92345 and is currently estimated at $458,299, approximately $267 per square foot. 17938 Walnut St is a home located in San Bernardino County with nearby schools including Lime Street Elementary School, Ranchero Middle School, and Sultana High School.
Ownership History
We collect this data history from publicly available records. To have your information removed, we recommend requesting removal directly through your county’s website.
Purchase Details
Home Financials for this Owner
Home Financials are based on the most recent Mortgage that was taken out on this home.Purchase Details
Home Financials for this Owner
Home Financials are based on the most recent Mortgage that was taken out on this home.Purchase Details
Home Financials for this Owner
Home Financials are based on the most recent Mortgage that was taken out on this home.Purchase Details
Purchase Details
Purchase Details
Home Financials for this Owner
Home Financials are based on the most recent Mortgage that was taken out on this home.Purchase Details
Home Financials for this Owner
Home Financials are based on the most recent Mortgage that was taken out on this home.Purchase Details
Home Financials for this Owner
Home Financials are based on the most recent Mortgage that was taken out on this home.Purchase Details
Home Financials for this Owner
Home Financials are based on the most recent Mortgage that was taken out on this home.Purchase Details
Home Financials for this Owner
Home Financials are based on the most recent Mortgage that was taken out on this home.Purchase Details
Home Financials for this Owner
Home Financials are based on the most recent Mortgage that was taken out on this home.Purchase Details
Purchase Details
Home Financials for this Owner
Home Financials are based on the most recent Mortgage that was taken out on this home.Purchase Details
Home Values in the Area
Average Home Value in this Area
Purchase History
We collect this data history from publicly available records. To have your information removed, we recommend requesting removal directly through your county’s website.
| Date | Buyer | Sale Price | Title Company |
|---|---|---|---|
| $230,000 | First American Title | ||
| -- | Chicago Title Company | ||
| $232,500 | First American Title Ins Co | ||
| $283,500 | First American Title | ||
| -- | None Available | ||
| $272,000 | Ticor Title Company | ||
| -- | Ticor Title Company | ||
| -- | -- | ||
| -- | First American Title Co | ||
| -- | First American Title Co | ||
| -- | Ticor Title Co | ||
| $85,000 | Landsafe Title | ||
| $67,640 | Landsafe Title | ||
| $82,500 | United Title | ||
| $76,825 | Fidelity National Title Ins |
Mortgage History
We collect this data history from publicly available records. To have your information removed, we recommend requesting removal directly through your county’s website.
| Date | Status | Borrower | Loan Amount |
|---|---|---|---|
| Previous Owner | $225,834 | ||
| Previous Owner | $179,100 | ||
| Previous Owner | $175,500 | ||
| Previous Owner | $270,000 | ||
| Previous Owner | $210,000 | ||
| Previous Owner | $210,000 | ||
| Previous Owner | $150,000 | ||
| Previous Owner | $84,960 | ||
| Previous Owner | $81,200 |
Tax History
We collect this data history from publicly available records. To have your information removed, we recommend requesting removal directly through your county’s website.
| Year | Tax Paid | Tax Assessment Tax Assessment Total Assessment is a certain percentage of the fair market value that is determined by local assessors to be the total taxable value of land and additions on the property. | Land | Improvement |
|---|---|---|---|---|
| 2025 | $2,864 | $261,700 | $52,339 | $209,361 |
| 2024 | $2,798 | $256,569 | $51,313 | $205,256 |
| 2023 | $2,766 | $251,538 | $50,307 | $201,231 |
| 2022 | $2,701 | $246,606 | $49,321 | $197,285 |
| 2021 | $2,651 | $241,771 | $48,354 | $193,417 |
| 2020 | $2,619 | $239,292 | $47,858 | $191,434 |
| 2019 | $2,563 | $234,600 | $46,920 | $187,680 |
| 2018 | $2,513 | $230,000 | $46,000 | $184,000 |
| 2017 | $2,490 | $222,600 | $29,300 | $193,300 |
| 2016 | $2,305 | $206,100 | $27,100 | $179,000 |
| 2015 | -- | $190,000 | $25,000 | $165,000 |
| 2014 | $1,627 | $141,500 | $28,800 | $112,700 |
Map
- 18060 Walnut St
- 18047 Yucca St
- 17908 Yucca St
- 18045 Juniper St
- 17846 Orange St
- 8899 Camphor Ave
- 9290 Buckthorn Ave
- 8878 Sabina Ave
- 17600 Orange St
- 18346 Main St
- 18376 Main St
- 17482 Walnut St
- 8984 Peach Ave
- 18186 Bangor Ave
- 9472 Guava Ave
- 17805 Bangor Ave
- 17487 Aspen St
- 18090 Hinton St
- 0 Buckthorn Ave Unit HD26097167
- 17542 Buckthorn Ave
- 17948 Walnut St
- 17918 Walnut St
- 0 Grapefruit Unit C10103006
- 0 Grapefruit Unit CV17174193
- 0 Grapefruit Ave
- 0 Grapefruit Unit 393387
- 0 Grapefruit Unit 393816
- 0 Grapefruit Unit 488605
- 17968 Walnut St
- 17908 Walnut St
- 17949 Main St
- 9046 Grapefruit Ave
- 17959 Main St
- 17929 Main St
- 17909 Walnut St
- 17915 Main St
- 17978 Walnut St
- 17888 Walnut St
- 9032 Grapefruit Ave
- 17973 Walnut St
Ask me questions while you tour the home.