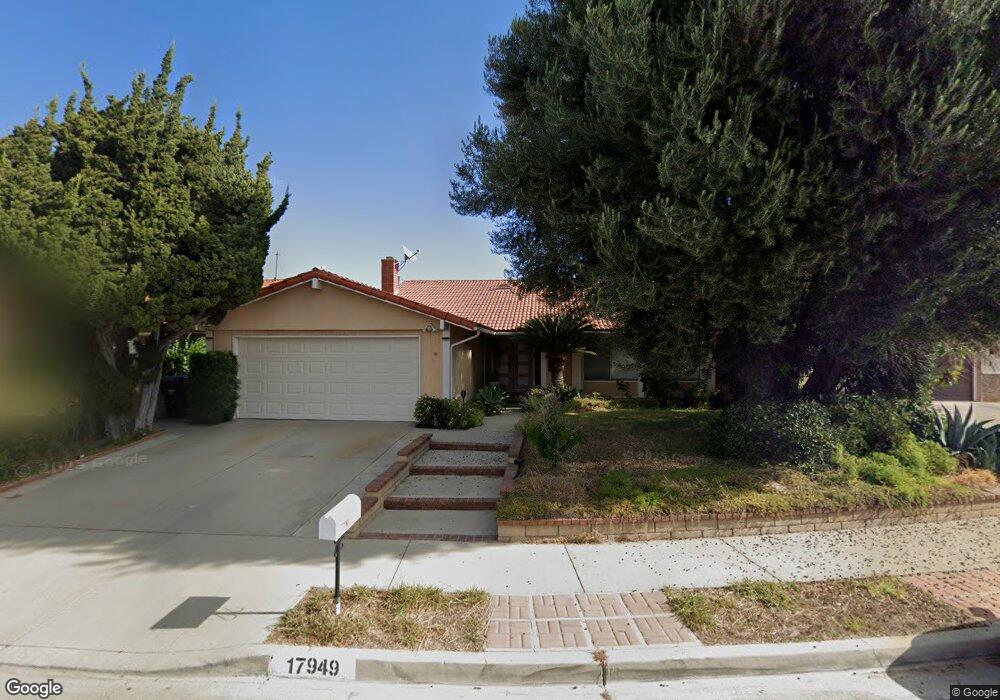
17949 Contador Dr Rowland Heights, CA 91748
Estimated Value: $971,000 - $1,148,000
3
Beds
2
Baths
1,798
Sq Ft
$586/Sq Ft
Est. Value
About This Home
This home is located at 17949 Contador Dr, Rowland Heights, CA 91748 and is currently estimated at $1,052,913, approximately $585 per square foot. 17949 Contador Dr is a home located in Los Angeles County with nearby schools including Rowland Elementary School, Alvarado Intermediate School, and John A. Rowland High School.
Ownership History
Date
Name
Owned For
Owner Type
Purchase Details
Closed on
Apr 18, 2020
Sold by
Leung Eric Chi Lik and Leung Annie Wu
Bought by
Leung Eric Chi Lik and Leung Annie Wu
Current Estimated Value
Purchase Details
Closed on
Dec 5, 2012
Sold by
Leung Eric C
Bought by
Leung Eric C and Leung Annie W
Home Financials for this Owner
Home Financials are based on the most recent Mortgage that was taken out on this home.
Original Mortgage
$300,000
Outstanding Balance
$207,655
Interest Rate
3.35%
Mortgage Type
New Conventional
Estimated Equity
$845,258
Purchase Details
Closed on
Jul 17, 1997
Sold by
Simon Tammy Ann
Bought by
Leung Eric C
Home Financials for this Owner
Home Financials are based on the most recent Mortgage that was taken out on this home.
Original Mortgage
$159,200
Interest Rate
7.42%
Create a Home Valuation Report for This Property
The Home Valuation Report is an in-depth analysis detailing your home's value as well as a comparison with similar homes in the area
Home Values in the Area
Average Home Value in this Area
Purchase History
| Date | Buyer | Sale Price | Title Company |
|---|---|---|---|
| Leung Eric Chi Lik | -- | None Available | |
| Leung Eric C | -- | Lsi | |
| Leung Eric C | $199,000 | American Title Ins Co |
Source: Public Records
Mortgage History
| Date | Status | Borrower | Loan Amount |
|---|---|---|---|
| Open | Leung Eric C | $300,000 | |
| Previous Owner | Leung Eric C | $159,200 |
Source: Public Records
Tax History Compared to Growth
Tax History
| Year | Tax Paid | Tax Assessment Tax Assessment Total Assessment is a certain percentage of the fair market value that is determined by local assessors to be the total taxable value of land and additions on the property. | Land | Improvement |
|---|---|---|---|---|
| 2025 | $4,395 | $317,727 | $116,069 | $201,658 |
| 2024 | $4,395 | $311,498 | $113,794 | $197,704 |
| 2023 | $4,209 | $305,391 | $111,563 | $193,828 |
| 2022 | $4,066 | $299,404 | $109,376 | $190,028 |
| 2021 | $3,992 | $293,534 | $107,232 | $186,302 |
| 2020 | $3,941 | $290,525 | $106,133 | $184,392 |
| 2019 | $3,874 | $284,829 | $104,052 | $180,777 |
| 2018 | $3,668 | $279,245 | $102,012 | $177,233 |
| 2016 | $3,516 | $268,402 | $98,051 | $170,351 |
| 2015 | $3,460 | $264,372 | $96,579 | $167,793 |
| 2014 | $3,459 | $259,195 | $94,688 | $164,507 |
Source: Public Records
Map
Nearby Homes
- 2503 Donosa Dr
- 2330 Donosa Dr
- 2503 Toro Dr
- 17812 Gallineta St
- 2048 Calle Bogota
- 17834 Calle Los Arboles
- 18220 Gallineta St
- 18239 Villa Clara St
- 2426 Batson Ave
- 2474 Patrician View Ave
- 18131 Camino Bello Unit 4
- 18225 Camino Bello Unit 4
- 18536 Mescal St
- 2521 Doubletree Ln
- 2306 Doubletree Ln
- 2010 La Cueva Dr
- 18109 Graystone Way
- 18620 Mescalero St
- 1902 Jellick Ave
- 18654 Del Bonita St
- 17955 Contador Dr
- 17943 Contador Dr
- 17961 Contador Dr
- 17939 Contador Dr
- 17933 Contador Dr
- 2353 Donosa Dr
- 2347 Donosa Dr
- 2359 Donosa Dr
- 2339 Donosa Dr
- 17962 Contador Dr
- 17946 Contador Dr
- 17954 Contador Dr
- 2365 Donosa Dr
- 17925 Contador Dr
- 17940 Contador Dr
- 2333 Donosa Dr
- 17934 Contador Dr
- 17960 Contador Dr
- 2371 Donosa Dr
- 17921 Contador Dr