1795 S Pitkin St Unit A Aurora, CO 80017
Aurora Highlands NeighborhoodEstimated Value: $211,000 - $225,170
2
Beds
2
Baths
981
Sq Ft
$224/Sq Ft
Est. Value
About This Home
This home is located at 1795 S Pitkin St Unit A, Aurora, CO 80017 and is currently estimated at $219,793, approximately $224 per square foot. 1795 S Pitkin St Unit A is a home located in Arapahoe County with nearby schools including Vassar Elementary School, Mrachek Middle School, and Rangeview High School.
Ownership History
Date
Name
Owned For
Owner Type
Purchase Details
Closed on
Oct 29, 1999
Sold by
Landau Penny
Bought by
Landau Tressie
Current Estimated Value
Purchase Details
Closed on
Oct 22, 1993
Sold by
Evans Scott
Bought by
Landau Tressie L
Purchase Details
Closed on
Dec 31, 1989
Sold by
Landau Tressie L
Bought by
Evans Scott Landau Tressie
Purchase Details
Closed on
Jun 21, 1988
Sold by
Evans Scott Landau Tressie
Bought by
Landau Tressie L
Purchase Details
Closed on
Jan 26, 1987
Sold by
Conversion Arapco
Bought by
Administrator Of Vets Affairs 44 Union B
Purchase Details
Closed on
Aug 1, 1984
Sold by
Conversion Arapco
Bought by
Conversion Arapco
Purchase Details
Closed on
Apr 1, 1984
Sold by
Conversion Arapco
Bought by
Conversion Arapco
Purchase Details
Closed on
Jun 1, 1982
Sold by
Conversion Arapco
Bought by
Conversion Arapco
Purchase Details
Closed on
Jul 4, 1776
Bought by
Conversion Arapco
Create a Home Valuation Report for This Property
The Home Valuation Report is an in-depth analysis detailing your home's value as well as a comparison with similar homes in the area
Home Values in the Area
Average Home Value in this Area
Purchase History
| Date | Buyer | Sale Price | Title Company |
|---|---|---|---|
| Landau Tressie | -- | -- | |
| Landau Tressie L | -- | -- | |
| Evans Scott Landau Tressie | -- | -- | |
| Landau Tressie L | -- | -- | |
| Evans Scott Landau Tressie | -- | -- | |
| Landau Klaus P | -- | -- | |
| Administrator Of Vets Affairs 44 Union B | -- | -- | |
| Conversion Arapco | -- | -- | |
| Conversion Arapco | -- | -- | |
| Conversion Arapco | -- | -- | |
| Conversion Arapco | -- | -- |
Source: Public Records
Tax History Compared to Growth
Tax History
| Year | Tax Paid | Tax Assessment Tax Assessment Total Assessment is a certain percentage of the fair market value that is determined by local assessors to be the total taxable value of land and additions on the property. | Land | Improvement |
|---|---|---|---|---|
| 2024 | $1,295 | $13,929 | -- | -- |
| 2023 | $1,295 | $13,929 | $0 | $0 |
| 2022 | $1,210 | $12,051 | $0 | $0 |
| 2021 | $1,249 | $12,051 | $0 | $0 |
| 2020 | $1,259 | $12,091 | $0 | $0 |
| 2019 | $1,252 | $12,091 | $0 | $0 |
| 2018 | $863 | $8,158 | $0 | $0 |
| 2017 | $750 | $8,158 | $0 | $0 |
| 2016 | $523 | $5,572 | $0 | $0 |
| 2015 | $505 | $5,572 | $0 | $0 |
| 2014 | $290 | $3,081 | $0 | $0 |
| 2013 | -- | $3,850 | $0 | $0 |
Source: Public Records
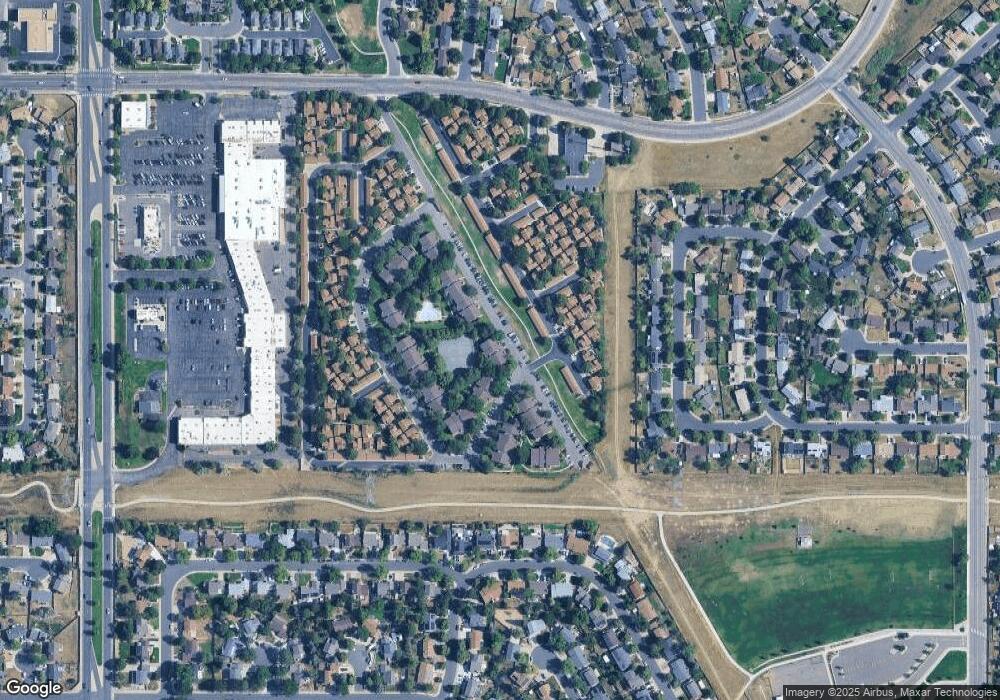
Map
Nearby Homes
- 1777 S Pitkin St Unit A
- 1757 S Pitkin St Unit A
- 1755 S Pitkin St Unit A
- 1751 S Pitkin St Unit A
- 1790 S Pitkin Cir Unit B
- 1840 S Pitkin Cir Unit A
- 1850 S Pitkin Cir Unit B
- 1876 S Pitkin Cir Unit B
- 1872 S Quintero Way Unit 130
- 1736 S Pagosa Way Unit 72
- 1837 S Pitkin Cir Unit 27
- 1825 S Pitkin Cir Unit 10
- 1861 S Pitkin Cir Unit B
- 1701 S Pitkin St Unit 65
- 2007 S Rifle St
- 2002 S Richfield St
- 1740 S Ouray Ct
- 1728 S Ouray St
- 16800 E Bails Place
- 16845 E Asbury Ave
- 1797 S Pitkin St Unit B
- 1797 S Pitkin St Unit A
- 1793 S Pitkin St Unit B
- 1793 S Pitkin St Unit A
- 1791 S Pitkin St Unit B
- 1791 S Pitkin St Unit A
- 1870 S Pitkin Cir Unit A
- 1872 S Pitkin Cir Unit B
- 1872 S Pitkin Cir Unit A
- 1872 S Pitkin Cir
- 1874 S Pitkin Cir Unit B
- 1874 S Pitkin Cir Unit A
- 1876 S Pitkin Cir Unit A
- 1787 S Pitkin St Unit B
- 1787 S Pitkin St Unit A
- 1875 S Pitkin St Unit B
- 1875 S Pitkin St Unit A
- 1877 S Pitkin St Unit B
- 1877 S Pitkin St Unit A
- 1785 S Pitkin St Unit B