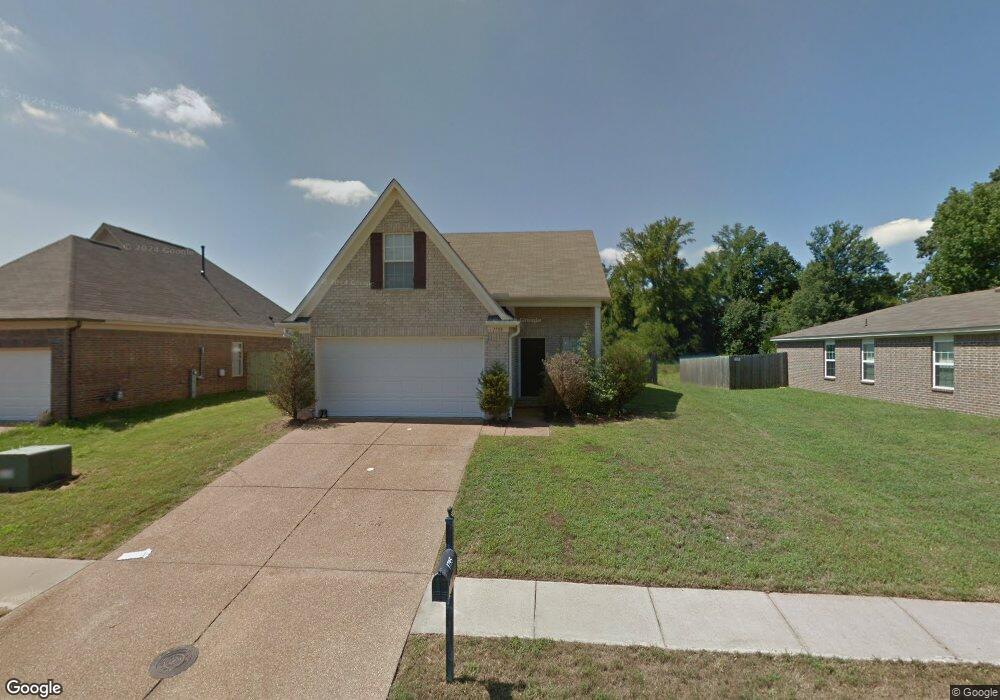
1795 Whatling St Cordova, TN 38016
Gray's Creek NeighborhoodEstimated Value: $231,000 - $240,993
3
Beds
2
Baths
1,450
Sq Ft
$163/Sq Ft
Est. Value
About This Home
This home is located at 1795 Whatling St, Cordova, TN 38016 and is currently estimated at $236,248, approximately $162 per square foot. 1795 Whatling St is a home located in Shelby County with nearby schools including Macon-Hall Elementary School, Mt. Pisgah Middle School, and Bolton High School.
Ownership History
Date
Name
Owned For
Owner Type
Purchase Details
Closed on
Mar 9, 2017
Sold by
My Good Deal Llc
Bought by
Allen Donald R and Allen Family Trust
Current Estimated Value
Home Financials for this Owner
Home Financials are based on the most recent Mortgage that was taken out on this home.
Original Mortgage
$91,500
Outstanding Balance
$75,919
Interest Rate
4.19%
Mortgage Type
New Conventional
Estimated Equity
$160,329
Purchase Details
Closed on
Dec 2, 2016
Sold by
Prochaska Joseph R
Bought by
My Good Deal Llc
Purchase Details
Closed on
Sep 29, 2009
Sold by
Signature Building Group General Partner
Bought by
Fox Leigh G P
Home Financials for this Owner
Home Financials are based on the most recent Mortgage that was taken out on this home.
Original Mortgage
$100,126
Interest Rate
5.03%
Mortgage Type
Balloon
Purchase Details
Closed on
May 1, 2007
Sold by
Hyneman Christian Development Llc
Bought by
Signature Bldg Group General Prtnrshp
Create a Home Valuation Report for This Property
The Home Valuation Report is an in-depth analysis detailing your home's value as well as a comparison with similar homes in the area
Home Values in the Area
Average Home Value in this Area
Purchase History
| Date | Buyer | Sale Price | Title Company |
|---|---|---|---|
| Allen Donald R | $122,000 | Delta Title Services Llc | |
| My Good Deal Llc | $98,000 | None Available | |
| Fox Leigh G P | -- | None Available | |
| Signature Bldg Group General Prtnrshp | $345,000 | None Available |
Source: Public Records
Mortgage History
| Date | Status | Borrower | Loan Amount |
|---|---|---|---|
| Open | Allen Donald R | $91,500 | |
| Previous Owner | Fox Leigh G P | $100,126 |
Source: Public Records
Tax History Compared to Growth
Tax History
| Year | Tax Paid | Tax Assessment Tax Assessment Total Assessment is a certain percentage of the fair market value that is determined by local assessors to be the total taxable value of land and additions on the property. | Land | Improvement |
|---|---|---|---|---|
| 2025 | $1,426 | $56,775 | $15,500 | $41,275 |
| 2024 | $1,426 | $42,050 | $8,300 | $33,750 |
| 2023 | $1,426 | $42,050 | $8,300 | $33,750 |
| 2022 | $1,426 | $42,050 | $8,300 | $33,750 |
| 2021 | $1,451 | $42,050 | $8,300 | $33,750 |
| 2020 | $1,269 | $31,325 | $8,300 | $23,025 |
| 2019 | $1,269 | $31,325 | $8,300 | $23,025 |
| 2018 | $1,269 | $31,325 | $8,300 | $23,025 |
| 2017 | $1,287 | $31,325 | $8,300 | $23,025 |
| 2016 | $1,153 | $26,375 | $0 | $0 |
| 2014 | $1,153 | $26,375 | $0 | $0 |
Source: Public Records
Map
Nearby Homes
- 10021 Branley Oak Dr
- 1830 Speyburn Cove
- 1832 Talisker Dr
- 1898 Glen Turret Dr
- 1802 N Houston Levee Rd
- 1818 N Houston Levee Rd
- 9931 Chivas Dr
- 9904 Averbury Cove
- 0 Oldham Dr Unit 10208811
- 9960 Oban Dr
- 1649 Brimhill Ln
- 10098 Sutton Ridge Ln
- 10133 Lynham Dr
- 1628 S Frence Creek Cove
- 1698 Pisgah Rd
- 2003 S Bend Dr
- 1623 Farkleberry Dr
- 1965 Rochelle Ln
- 9740 N Bloomington Cir
- 1977 Rochelle Ln
- 1789 Whatling St
- 1801 Whatling St
- 1807 Watling St
- 1783 Whatling St
- 1807 Whatling St
- 10016 Messana St
- 10049 Mill Hill Ave
- 10052 Woodlee Cove
- 10040 Nolton Cir
- 1777 Whatling St
- 10053 Mill Hill Ave
- 10056 Woodlee Cove
- 1778 Messana St
- 10059 Mill Hill Ave
- 10060 Woodlee Cove
- 1771 Whatling St
- 10046 Nolton Cir
- 10051 Woodlee Cove
- 10063 Mill Hill Ave
- 10064 Woodlee Cove