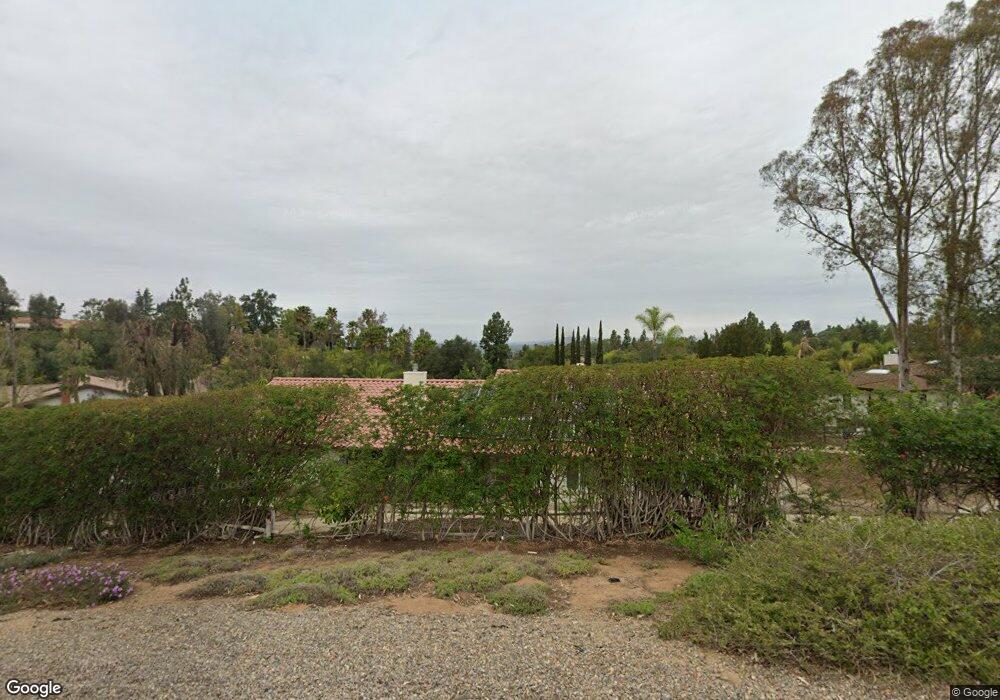
17950 Bernardo Trails Place San Diego, CA 92128
Rancho Bernardo NeighborhoodEstimated Value: $1,448,501 - $1,533,000
3
Beds
2
Baths
2,042
Sq Ft
$730/Sq Ft
Est. Value
About This Home
This home is located at 17950 Bernardo Trails Place, San Diego, CA 92128 and is currently estimated at $1,489,875, approximately $729 per square foot. 17950 Bernardo Trails Place is a home located in San Diego County with nearby schools including Chaparral Elementary, Bernardo Heights Middle, and Rancho Bernardo High.
Ownership History
Date
Name
Owned For
Owner Type
Purchase Details
Closed on
Jun 25, 2021
Sold by
Roberts Natalie and Roberts Mark
Bought by
Roberts Natalie and Roberts Mark
Current Estimated Value
Purchase Details
Closed on
Oct 10, 2019
Sold by
Roberts Mark and Roberts Natalie
Bought by
Roberts Mark and Roberts Natalie
Home Financials for this Owner
Home Financials are based on the most recent Mortgage that was taken out on this home.
Original Mortgage
$620,000
Outstanding Balance
$542,034
Interest Rate
3.4%
Mortgage Type
New Conventional
Estimated Equity
$947,841
Purchase Details
Closed on
Aug 7, 2014
Sold by
Hopley Ronald Bruce
Bought by
Roberts Mark A and Maniaci Natalie T
Home Financials for this Owner
Home Financials are based on the most recent Mortgage that was taken out on this home.
Original Mortgage
$546,250
Interest Rate
4.12%
Mortgage Type
New Conventional
Purchase Details
Closed on
Sep 15, 1994
Sold by
Hopley Eric E and Hopley Shirley H
Bought by
Hopley Eric E and Hopley Shirley H
Create a Home Valuation Report for This Property
The Home Valuation Report is an in-depth analysis detailing your home's value as well as a comparison with similar homes in the area
Home Values in the Area
Average Home Value in this Area
Purchase History
| Date | Buyer | Sale Price | Title Company |
|---|---|---|---|
| Roberts Natalie | -- | None Available | |
| Roberts Mark | -- | Stewart Title Of Ca Inc | |
| Roberts Mark A | $740,000 | First American Title Company | |
| Hopley Eric E | -- | -- |
Source: Public Records
Mortgage History
| Date | Status | Borrower | Loan Amount |
|---|---|---|---|
| Open | Roberts Mark | $620,000 | |
| Closed | Roberts Mark A | $546,250 |
Source: Public Records
Tax History Compared to Growth
Tax History
| Year | Tax Paid | Tax Assessment Tax Assessment Total Assessment is a certain percentage of the fair market value that is determined by local assessors to be the total taxable value of land and additions on the property. | Land | Improvement |
|---|---|---|---|---|
| 2025 | $9,792 | $889,359 | $300,291 | $589,068 |
| 2024 | $9,792 | $871,921 | $294,403 | $577,518 |
| 2023 | $9,583 | $854,826 | $288,631 | $566,195 |
| 2022 | $9,422 | $838,066 | $282,972 | $555,094 |
| 2021 | $9,298 | $821,634 | $277,424 | $544,210 |
| 2020 | $9,172 | $813,210 | $274,580 | $538,630 |
| 2019 | $8,932 | $797,266 | $269,197 | $528,069 |
| 2018 | $8,680 | $781,634 | $263,919 | $517,715 |
| 2017 | $8,447 | $766,309 | $258,745 | $507,564 |
| 2016 | $8,273 | $751,284 | $253,672 | $497,612 |
| 2015 | $8,149 | $740,000 | $249,862 | $490,138 |
| 2014 | $2,062 | $189,719 | $64,059 | $125,660 |
Source: Public Records
Map
Nearby Homes
- 12732 Camino de la Breccia Unit 9
- 17842 Avenida Cordillera Unit 30
- 12977 Camino Emparrado
- 12870 Camino de la Breccia
- 17676 Corte Sobrado
- 12516 Camino Vuelo
- 17762 Plaza Acosta
- 17738 Plaza Acosta
- 12880 Circulo Dardo
- 12865 Camino de la Breccia Unit 109
- 18035 Avenida Alozdra Unit 298
- 18304 Vezelay Ln
- 12725 Via Nasca
- 12580 Oaks North Dr Unit 12
- 12982 Polvera Ct
- 17909 Avenida Alozdra
- 12564 Chetenham Ln
- 17780 Cumana Terrace
- 17617 Pomerado Rd Unit 213
- 18018 Calle Estepona
- 17990 Bernardo Trails Place
- 17890 Bernardo Trails Place
- 17955 Bernardo Trails Place
- 17870 Bernardo Trails Place
- 17975 Bernardo Trails Place
- 17895 Bernardo Trails Place
- 17875 Bernardo Trails Place
- 18525 Bernardo Trails Dr
- 17995 Bernardo Trails Place
- 18450 Bernardo Trails Dr Unit 1
- 17885 Bernardo Trails Place Unit 2
- 18480 Bernardo Trails Dr
- 12668 Camino Emparrado
- 17865 Bernardo Trails Place
- 12660 Camino Emparrado
- 12678 Camino Emparrado
- 12650 Camino Emparrado
- 17850 Bernardo Trails Place
- 12690 Senda Acantilada
- 12642 Camino Emparrado