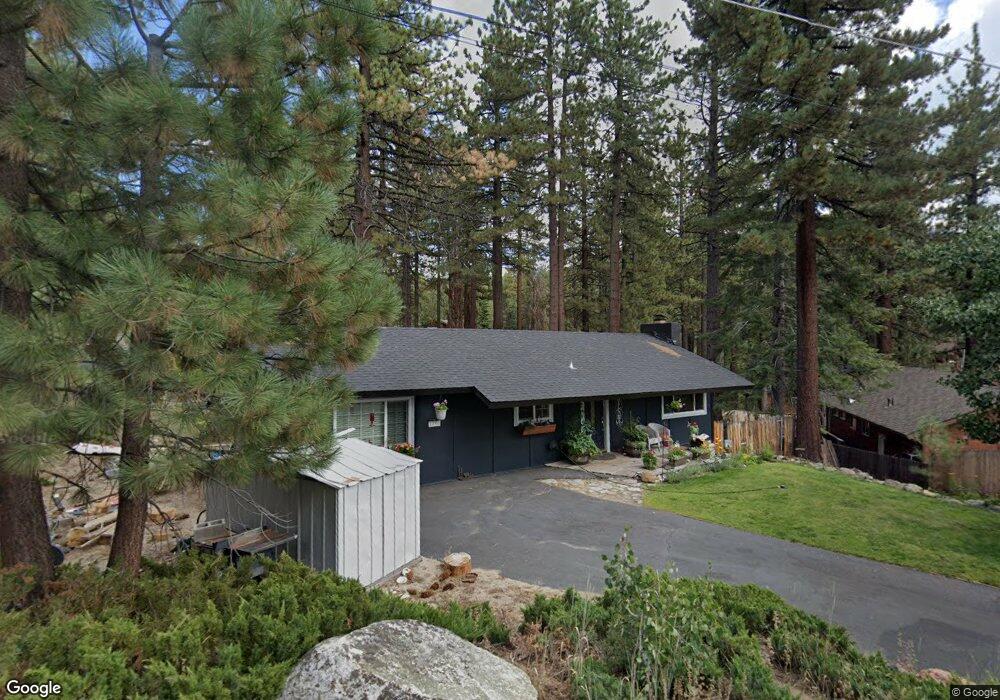
1796 Fortune Way South Lake Tahoe, CA 96150
Estimated Value: $618,812 - $797,000
3
Beds
1
Bath
1,525
Sq Ft
$443/Sq Ft
Est. Value
About This Home
This home is located at 1796 Fortune Way, South Lake Tahoe, CA 96150 and is currently estimated at $676,203, approximately $443 per square foot. 1796 Fortune Way is a home located in El Dorado County with nearby schools including Sierra House Elementary School, South Tahoe Middle School, and South Tahoe High School.
Ownership History
Date
Name
Owned For
Owner Type
Purchase Details
Closed on
Nov 16, 2020
Sold by
White Lisa L
Bought by
White Lisa L and Herrera Eian Joseph
Current Estimated Value
Home Financials for this Owner
Home Financials are based on the most recent Mortgage that was taken out on this home.
Original Mortgage
$105,000
Outstanding Balance
$93,435
Interest Rate
2.8%
Mortgage Type
New Conventional
Estimated Equity
$582,768
Purchase Details
Closed on
Sep 5, 2001
Sold by
Herrera Nunez Jose A
Bought by
White Lisa L
Home Financials for this Owner
Home Financials are based on the most recent Mortgage that was taken out on this home.
Original Mortgage
$94,000
Interest Rate
6.99%
Purchase Details
Closed on
Aug 30, 2001
Sold by
Va
Bought by
Herrera Nunez Jose A and White Lisa L
Home Financials for this Owner
Home Financials are based on the most recent Mortgage that was taken out on this home.
Original Mortgage
$94,000
Interest Rate
6.99%
Create a Home Valuation Report for This Property
The Home Valuation Report is an in-depth analysis detailing your home's value as well as a comparison with similar homes in the area
Home Values in the Area
Average Home Value in this Area
Purchase History
| Date | Buyer | Sale Price | Title Company |
|---|---|---|---|
| White Lisa L | -- | Stewart Title Company Of Ca | |
| White Lisa L | -- | Fidelity National Title Co | |
| Herrera Nunez Jose A | -- | Fidelity National Title Co |
Source: Public Records
Mortgage History
| Date | Status | Borrower | Loan Amount |
|---|---|---|---|
| Open | White Lisa L | $105,000 | |
| Closed | White Lisa L | $94,000 |
Source: Public Records
Tax History Compared to Growth
Tax History
| Year | Tax Paid | Tax Assessment Tax Assessment Total Assessment is a certain percentage of the fair market value that is determined by local assessors to be the total taxable value of land and additions on the property. | Land | Improvement |
|---|---|---|---|---|
| 2025 | $1,756 | $164,615 | $51,491 | $113,124 |
| 2024 | $1,756 | $161,388 | $50,482 | $110,906 |
| 2023 | $1,726 | $158,225 | $49,493 | $108,732 |
| 2022 | $1,707 | $155,123 | $48,523 | $106,600 |
| 2021 | $1,678 | $152,082 | $47,572 | $104,510 |
| 2020 | $1,656 | $150,524 | $47,085 | $103,439 |
| 2019 | $1,647 | $147,573 | $46,162 | $101,411 |
| 2018 | $1,610 | $144,680 | $45,257 | $99,423 |
| 2017 | $1,585 | $141,844 | $44,370 | $97,474 |
| 2016 | $1,552 | $139,063 | $43,500 | $95,563 |
| 2015 | $1,474 | $136,977 | $42,848 | $94,129 |
| 2014 | $1,474 | $134,295 | $42,009 | $92,286 |
Source: Public Records
Map
Nearby Homes
- 2480 Sierra House Trail
- 2285 Del Norte St
- 2245 Cold Creek Trail
- 2647 Cold Creek Trail
- 1700 Black Bart Ct
- 1675 Black Bart Ct
- 1909 High Meadow Trail
- 2317 Sutter Trail
- 1920 High Meadow Trail
- 1812 Jack Bell Ct
- 45 Maiden Hair Ct Unit Lot45
- 1637 Black Bart Ct
- 1993 High Meadow Trail
- 2489 Fair Meadow Ct
- 1626 Plateau Cir
- 2359 Wagon Train Trail
- 0 Wagon Train Trail
- 2200 Marshall Trail
- 1462 Chinquapin Dr
- 1496 Horace Greeley Ave
- 2428 Del Norte St
- 2427 Cold Creek Trail
- 2420 Del Norte St
- 1797 Fortune Way
- 1805 Fortune Way
- 2440 Del Norte St
- 2442 Cold Creek Trail
- 2434 Cold Creek Trail
- 2463 Cold Creek Trail
- 2407 Cold Creek Trail
- 2428 Cold Creek Trail
- 2450 Cold Creek Trail
- 2452 Del Norte St
- 2327 Alice Lake Rd
- 2460 Cold Creek Trail
- 2471 Cold Creek Trail
- 2465 Bernice Ln
- 2457 Bernice Ln
- 2337 Alice Lake Rd
- 1766 Fortune Way