Estimated Value: $504,000 - $695,033
2
Beds
1
Bath
1,343
Sq Ft
$437/Sq Ft
Est. Value
About This Home
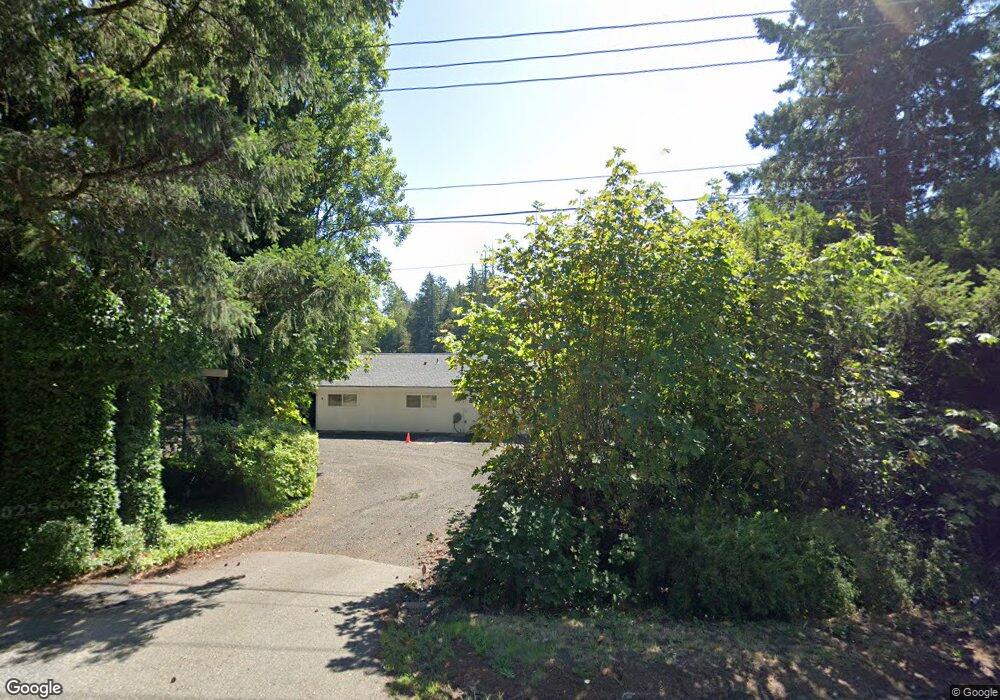
This home is located at 17960 E State Route 3 Unit B, Allyn, WA 98524 and is currently estimated at $586,258, approximately $436 per square foot. 17960 E State Route 3 Unit B is a home located in Mason County with nearby schools including North Mason Senior High School.
Ownership History
Date
Name
Owned For
Owner Type
Purchase Details
Closed on
Dec 29, 2025
Sold by
Palmer Douglas
Bought by
Palmer Kelly
Current Estimated Value
Purchase Details
Closed on
Feb 19, 2021
Sold by
Eacrett Steven and Eacrett Kathleen Mary
Bought by
Palmer Douglas and Palmer Kelly
Home Financials for this Owner
Home Financials are based on the most recent Mortgage that was taken out on this home.
Original Mortgage
$125,001
Interest Rate
2.65%
Mortgage Type
New Conventional
Purchase Details
Closed on
Jul 10, 2014
Sold by
Bartling Dennis and Bartling Gerald
Bought by
Eacrett Steva and Eacrett Kathleen Mary
Home Financials for this Owner
Home Financials are based on the most recent Mortgage that was taken out on this home.
Original Mortgage
$208,125
Interest Rate
4.1%
Mortgage Type
New Conventional
Purchase Details
Closed on
Nov 9, 2004
Sold by
Bartling Linda and Bartling Phyllis May
Bought by
Bartling Dennis and Bartling Gerald
Create a Home Valuation Report for This Property
The Home Valuation Report is an in-depth analysis detailing your home's value as well as a comparison with similar homes in the area
Home Values in the Area
Average Home Value in this Area
Purchase History
| Date | Buyer | Sale Price | Title Company |
|---|---|---|---|
| Palmer Kelly | -- | None Listed On Document | |
| Palmer Douglas | $392,050 | Olympic Title And Escrow | |
| Palmer Douglas | $392,050 | Olympic Title And Escrow | |
| Eacrett Steva | $277,500 | Land Title Co | |
| Bartling Dennis | -- | None Available |
Source: Public Records
Mortgage History
| Date | Status | Borrower | Loan Amount |
|---|---|---|---|
| Previous Owner | Palmer Douglas | $125,001 | |
| Previous Owner | Eacrett Steva | $208,125 |
Source: Public Records
Tax History
| Year | Tax Paid | Tax Assessment Tax Assessment Total Assessment is a certain percentage of the fair market value that is determined by local assessors to be the total taxable value of land and additions on the property. | Land | Improvement |
|---|---|---|---|---|
| 2025 | $4,549 | $574,090 | $213,190 | $360,900 |
| 2023 | $4,549 | $425,730 | $213,190 | $212,540 |
| 2022 | $3,247 | $358,340 | $133,795 | $224,545 |
| 2021 | $3,173 | $492,135 | $267,590 | $224,545 |
| 2020 | $3,758 | $363,740 | $243,265 | $120,475 |
| 2018 | $3,764 | $317,660 | $231,680 | $85,980 |
| 2017 | $3,557 | $317,485 | $231,505 | $85,980 |
| 2016 | $3,737 | $309,670 | $231,505 | $78,165 |
| 2015 | $3,782 | $326,625 | $228,045 | $98,580 |
| 2014 | -- | $334,785 | $230,470 | $104,315 |
| 2013 | -- | $291,515 | $194,080 | $97,435 |
Source: Public Records
Map
Nearby Homes
- 17991 E State Route 3
- 61 E Channel Dr
- 0 E Wheelwright St S
- 17717 E State Route 3
- 7360 E Grapeview Loop Rd
- 170 E Lakeland Dr
- 40 E Lakeshore Dr
- 11 E Eberhart Ln
- 71 E Sullivan St
- 31 E Village View Dr
- 41 E Westlake Place
- 17 E Sellegren Rd
- 10 E Compass Ln
- 61 E Brady Loop
- 160 E Lakeland Way
- 201 E Country Club Dr
- 140 E Cedarland Ln
- 0 E Sullivan St Unit NWM2494712
- 140 E Sullivan St
- 0 xxxx E Sullivan St
- 17960 E State Route 3 Unit A & B
- 17960 E State Route 3 Unit A
- 17960 E State Route 3
- 1 E Sherwood Creek Rd
- 0 E Sherwood Creek Rd
- 14941 E State Route 3
- 17990 Washington 3
- 17990 E State Route 3
- 17733 E State Route 3
- 18000 E State Route 3
- 102025 VL Undisclosed
- 101 E Steves Place
- 18020 E State Route 3
- 80 E Steves Place
- 18011 E State Route 3
- 5442 E Grapeview Loop Rd
- 7740 E Grapeview Loop Rd
- 68 xxx Grapeview Loop Rd
- 0 TR3 Grapeview Loop Rd
- 5 ACRE Grapeview Loop Rd
Your Personal Tour Guide
Ask me questions while you tour the home.