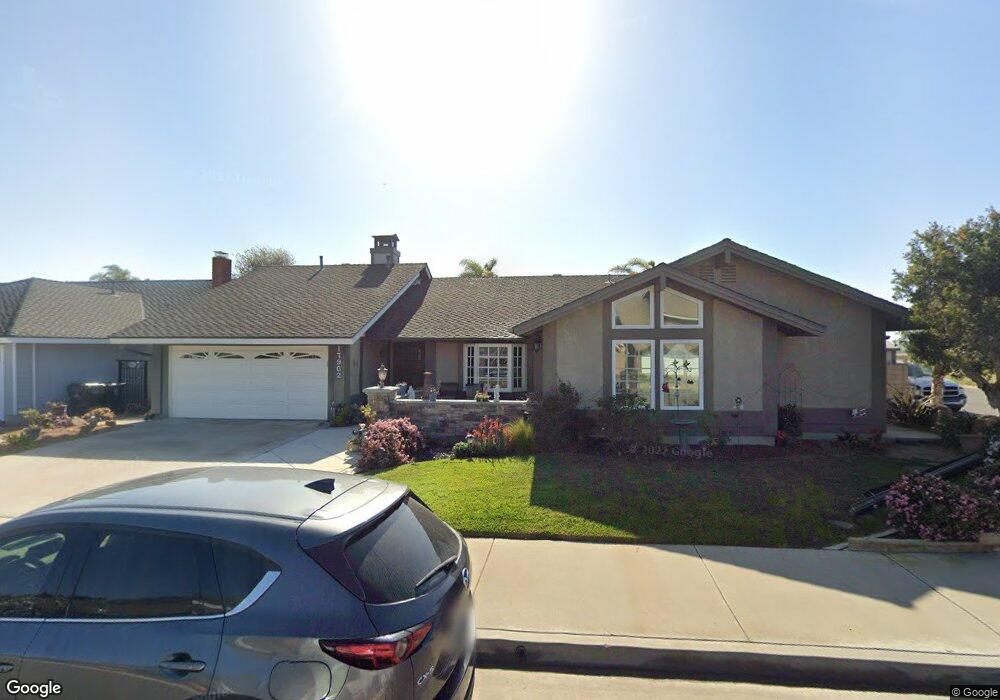
17962 Shoreham Ln Huntington Beach, CA 92649
Estimated Value: $1,608,000 - $1,757,000
4
Beds
2
Baths
2,052
Sq Ft
$824/Sq Ft
Est. Value
About This Home
This home is located at 17962 Shoreham Ln, Huntington Beach, CA 92649 and is currently estimated at $1,691,595, approximately $824 per square foot. 17962 Shoreham Ln is a home located in Orange County with nearby schools including Hope View Elementary School, Marine View Middle, and Huntington Beach High School.
Ownership History
Date
Name
Owned For
Owner Type
Purchase Details
Closed on
Mar 26, 2012
Sold by
Pierce Lowell G and Nichols Pierce Debra Rae
Bought by
Pierce Lowell G and Nichols Pierce Debra Rae
Current Estimated Value
Purchase Details
Closed on
Apr 12, 2011
Sold by
Simmons Michael T
Bought by
Pierce Lowell G and Pierce Debra R
Home Financials for this Owner
Home Financials are based on the most recent Mortgage that was taken out on this home.
Original Mortgage
$258,000
Outstanding Balance
$178,329
Interest Rate
4.84%
Mortgage Type
New Conventional
Estimated Equity
$1,513,266
Purchase Details
Closed on
Mar 22, 2001
Sold by
Simmons Michael T
Bought by
Simmons Michael T and The Simmons Family Trust
Purchase Details
Closed on
Mar 26, 1996
Sold by
Eason Frank Edwin
Bought by
Simmons Michael T
Home Financials for this Owner
Home Financials are based on the most recent Mortgage that was taken out on this home.
Original Mortgage
$207,000
Interest Rate
7.97%
Create a Home Valuation Report for This Property
The Home Valuation Report is an in-depth analysis detailing your home's value as well as a comparison with similar homes in the area
Home Values in the Area
Average Home Value in this Area
Purchase History
| Date | Buyer | Sale Price | Title Company |
|---|---|---|---|
| Pierce Lowell G | -- | None Available | |
| Pierce Lowell G | $750,000 | First American Title Company | |
| Simmons Michael T | -- | -- | |
| Simmons Michael T | $282,000 | Old Republic Title Company |
Source: Public Records
Mortgage History
| Date | Status | Borrower | Loan Amount |
|---|---|---|---|
| Open | Pierce Lowell G | $258,000 | |
| Previous Owner | Simmons Michael T | $207,000 |
Source: Public Records
Tax History Compared to Growth
Tax History
| Year | Tax Paid | Tax Assessment Tax Assessment Total Assessment is a certain percentage of the fair market value that is determined by local assessors to be the total taxable value of land and additions on the property. | Land | Improvement |
|---|---|---|---|---|
| 2025 | $11,407 | $1,033,107 | $844,834 | $188,273 |
| 2024 | $11,407 | $1,012,850 | $828,268 | $184,582 |
| 2023 | $11,151 | $992,991 | $812,028 | $180,963 |
| 2022 | $10,990 | $973,521 | $796,106 | $177,415 |
| 2021 | $10,787 | $954,433 | $780,496 | $173,937 |
| 2020 | $10,666 | $944,647 | $772,493 | $172,154 |
| 2019 | $10,476 | $926,125 | $757,346 | $168,779 |
| 2018 | $10,238 | $907,966 | $742,496 | $165,470 |
| 2017 | $10,073 | $890,163 | $727,937 | $162,226 |
| 2016 | $9,653 | $872,709 | $713,663 | $159,046 |
| 2015 | $9,506 | $859,601 | $702,944 | $156,657 |
| 2014 | $9,318 | $842,763 | $689,174 | $153,589 |
Source: Public Records
Map
Nearby Homes
- 17982 Whitford Ln
- 5812 Raphael Dr
- 5862 Raphael Dr
- 6012 Jasonwood Dr
- 18202 Foss Ln
- 6171 Kiser Dr
- 18321 Fieldbury Ln
- 17301 Juniper Ln
- 5262 Glenroy Dr
- 17442 Coronado Ln
- 17202 Corbina Ln Unit 108
- 5241 Glenroy Dr
- 17191 Corbina Ln Unit 110
- 17042 Twain Ln
- 17472 Oakbluffs Ln
- 6051 Summerdale Dr
- 17231 Lido Ln
- 4746 Oceanridge Dr
- 17071 Pinehurst Ln
- 17291 Wareham Ln
- 17942 Shoreham Ln
- 17971 Whitford Ln
- 17961 Whitford Ln
- 17932 Shoreham Ln
- 17951 Whitford Ln
- 17931 Shoreham Ln
- 17941 Shoreham Ln
- 17921 Shoreham Ln
- 17941 Whitford Ln
- 17922 Shoreham Ln
- 17931 Whitford Ln
- 17912 Denvale Cir
- 17922 Denvale Cir
- 17972 Whitford Ln
- 17912 Shoreham Ln
- 17962 Whitford Ln
- 17902 Denvale Cir
- 5631 Selkirk Dr
- 17921 Whitford Ln
- 17952 Whitford Ln