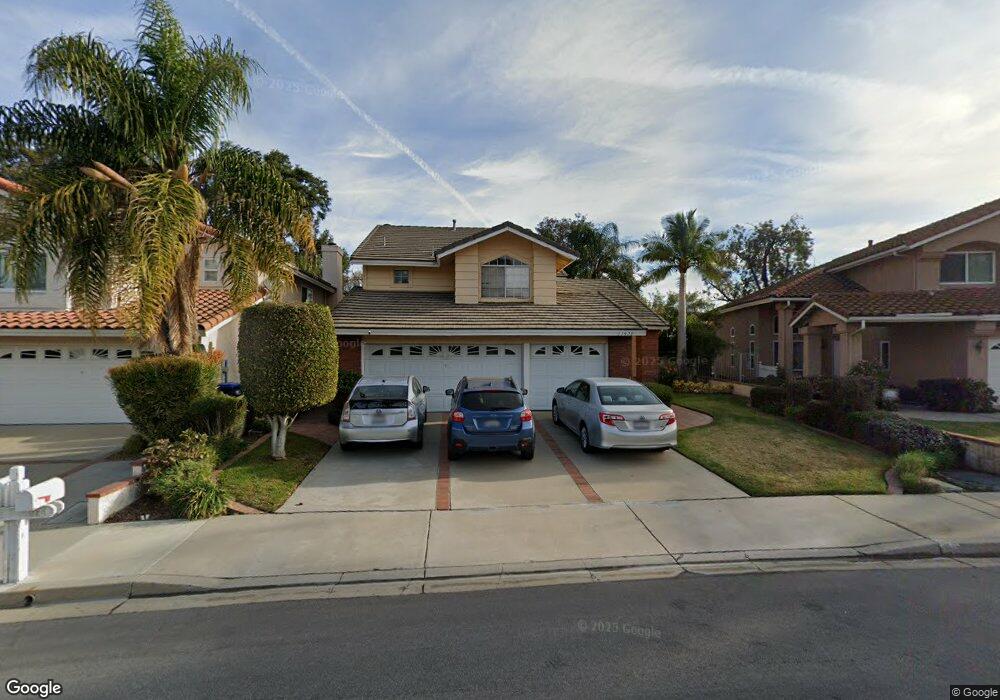
17971 Via Frontera Chino Hills, CA 91709
Butterfield NeighborhoodEstimated Value: $939,406 - $1,084,000
3
Beds
3
Baths
2,225
Sq Ft
$457/Sq Ft
Est. Value
About This Home
This home is located at 17971 Via Frontera, Chino Hills, CA 91709 and is currently estimated at $1,017,102, approximately $457 per square foot. 17971 Via Frontera is a home located in San Bernardino County with nearby schools including Butterfield Ranch Elementary School, Robert O. Townsend Junior High School, and Chino Hills High School.
Ownership History
Date
Name
Owned For
Owner Type
Purchase Details
Closed on
Jul 6, 2012
Sold by
Huang James
Bought by
Chow Denice
Current Estimated Value
Home Financials for this Owner
Home Financials are based on the most recent Mortgage that was taken out on this home.
Original Mortgage
$219,200
Outstanding Balance
$151,024
Interest Rate
3.63%
Mortgage Type
New Conventional
Estimated Equity
$866,078
Purchase Details
Closed on
Jul 2, 2003
Sold by
Azumah Michael and Stokes Bridgette
Bought by
Chow Denice
Home Financials for this Owner
Home Financials are based on the most recent Mortgage that was taken out on this home.
Original Mortgage
$255,000
Interest Rate
5.22%
Mortgage Type
Purchase Money Mortgage
Purchase Details
Closed on
Mar 30, 1999
Sold by
Godinez Raymond
Bought by
Stokes Azumah Michael and Stokes Azumah Bridgette
Home Financials for this Owner
Home Financials are based on the most recent Mortgage that was taken out on this home.
Original Mortgage
$228,950
Interest Rate
6.98%
Purchase Details
Closed on
Jan 30, 1995
Sold by
Garcia Oscar and Garcia Carmen M
Bought by
Godinez Raymonod
Create a Home Valuation Report for This Property
The Home Valuation Report is an in-depth analysis detailing your home's value as well as a comparison with similar homes in the area
Home Values in the Area
Average Home Value in this Area
Purchase History
| Date | Buyer | Sale Price | Title Company |
|---|---|---|---|
| Chow Denice | -- | Advantage Title Inc | |
| Chow Denice | -- | None Available | |
| Chow Denice | $375,000 | Chicago Title Co | |
| Stokes Azumah Michael | $241,000 | First American Title Ins Co | |
| Godinez Raymonod | -- | -- |
Source: Public Records
Mortgage History
| Date | Status | Borrower | Loan Amount |
|---|---|---|---|
| Open | Chow Denice | $219,200 | |
| Closed | Chow Denice | $219,200 | |
| Closed | Chow Denice | $255,000 | |
| Previous Owner | Stokes Azumah Michael | $228,950 |
Source: Public Records
Tax History Compared to Growth
Tax History
| Year | Tax Paid | Tax Assessment Tax Assessment Total Assessment is a certain percentage of the fair market value that is determined by local assessors to be the total taxable value of land and additions on the property. | Land | Improvement |
|---|---|---|---|---|
| 2025 | $6,050 | $533,177 | $186,613 | $346,564 |
| 2024 | $6,050 | $522,723 | $182,954 | $339,769 |
| 2023 | $5,890 | $512,474 | $179,367 | $333,107 |
| 2022 | $5,857 | $502,425 | $175,850 | $326,575 |
| 2021 | $5,748 | $492,574 | $172,402 | $320,172 |
| 2020 | $5,677 | $487,523 | $170,634 | $316,889 |
| 2019 | $5,582 | $477,963 | $167,288 | $310,675 |
| 2018 | $5,465 | $468,591 | $164,008 | $304,583 |
| 2017 | $5,372 | $459,403 | $160,792 | $298,611 |
| 2016 | $5,037 | $450,395 | $157,639 | $292,756 |
| 2015 | $4,868 | $443,630 | $155,271 | $288,359 |
| 2014 | $4,775 | $434,939 | $152,229 | $282,710 |
Source: Public Records
Map
Nearby Homes
- 6657 Canterbury Dr Unit 201
- 6631 Laurelton Ln Unit 203
- 17883 Graystone Ave Unit 201
- 17916 Via Casitas
- 17871 Shady View Dr Unit 704
- 6551 Coyote St
- 18391 Errol Way
- 6672 Menzies Place
- 6494 Via Del Prado
- 17871 Shady Unit 1103
- Plan 2 at Shady View - Oak
- Plan 1 at Shady View - Oak
- Plan 4 at Shady View - Sycamore
- Plan 6 at Shady View - Sycamore
- Plan 5 at Shady View - Sycamore
- Plan 3 at Shady View - Oak
- 17929 Paseo Del Sol
- 18218 Matilija Way
- 18273 Matilija Way
- 17862 Antherium Dr
- 17965 Via Frontera
- 17977 Via Frontera
- 17983 Via Frontera
- 6583 Via Del Prado
- 17987 Via Frontera
- 17958 South Trail
- 17952 South Trail
- 17964 South Trail
- 6577 Via Del Prado
- 17970 South Trail
- 17982 Via Frontera
- 6590 Via Del Prado
- 17946 South Trail
- 6584 Via Del Prado
- 6578 Via Del Prado
- 17976 South Trail
- 6572 Via Del Prado
- 17982 South Trail
- 6571 Via Del Prado
- 17988 South Trail