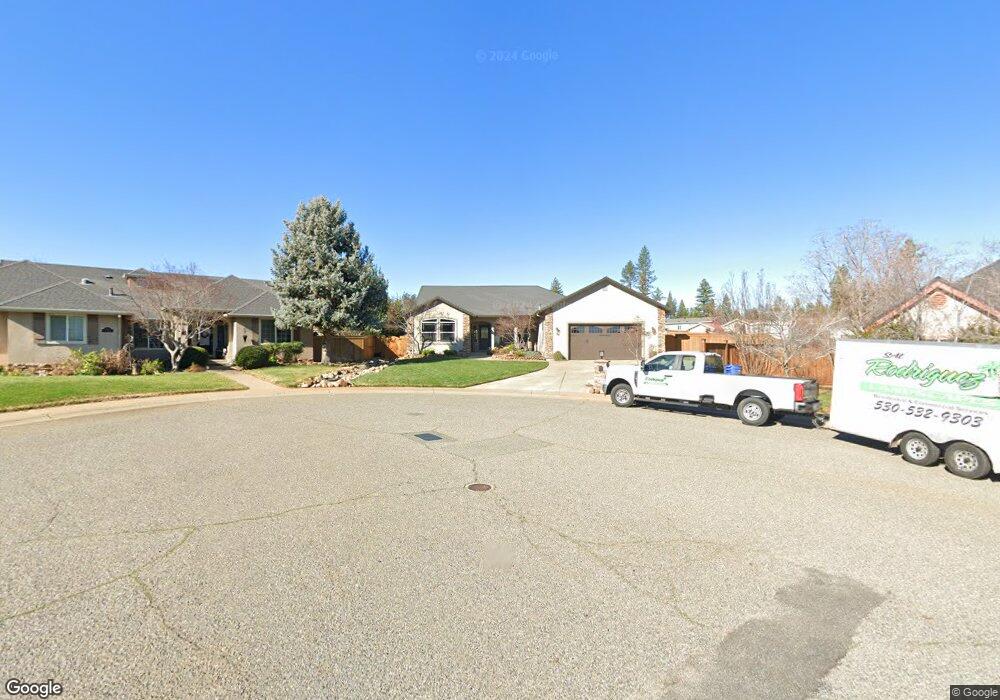
1799 Chris Ct Paradise, CA 95969
Estimated Value: $498,000 - $892,000
4
Beds
2
Baths
2,506
Sq Ft
$254/Sq Ft
Est. Value
About This Home
This home is located at 1799 Chris Ct, Paradise, CA 95969 and is currently estimated at $637,077, approximately $254 per square foot. 1799 Chris Ct is a home located in Butte County with nearby schools including Ponderosa Elementary School, Paradise Junior High School, and Paradise Senior High School.
Ownership History
Date
Name
Owned For
Owner Type
Purchase Details
Closed on
May 2, 2018
Sold by
Palade Wesley W and Palade Sheri R
Bought by
Palade Wesley W and Palade Sheri R
Current Estimated Value
Purchase Details
Closed on
May 23, 2002
Sold by
Durman Steven B and Durman Sharon L
Bought by
Palade Wesley W and Palade Sheri R
Home Financials for this Owner
Home Financials are based on the most recent Mortgage that was taken out on this home.
Original Mortgage
$48,000
Outstanding Balance
$19,997
Interest Rate
6.74%
Estimated Equity
$617,080
Purchase Details
Closed on
Jun 25, 2001
Sold by
Patrick Burns & Andrew Sprague General P
Bought by
Durman Steven B and Durman Sharon L
Home Financials for this Owner
Home Financials are based on the most recent Mortgage that was taken out on this home.
Original Mortgage
$13,000
Interest Rate
7.14%
Create a Home Valuation Report for This Property
The Home Valuation Report is an in-depth analysis detailing your home's value as well as a comparison with similar homes in the area
Home Values in the Area
Average Home Value in this Area
Purchase History
| Date | Buyer | Sale Price | Title Company |
|---|---|---|---|
| Palade Wesley W | -- | None Available | |
| Palade Wesley W | -- | None Available | |
| Palade Wesley W | $68,500 | Mid Valley Title Co | |
| Durman Steven B | $61,500 | Mid Valley Title |
Source: Public Records
Mortgage History
| Date | Status | Borrower | Loan Amount |
|---|---|---|---|
| Open | Palade Wesley W | $48,000 | |
| Previous Owner | Durman Steven B | $13,000 |
Source: Public Records
Tax History Compared to Growth
Tax History
| Year | Tax Paid | Tax Assessment Tax Assessment Total Assessment is a certain percentage of the fair market value that is determined by local assessors to be the total taxable value of land and additions on the property. | Land | Improvement |
|---|---|---|---|---|
| 2025 | $5,450 | $523,254 | $101,181 | $422,073 |
| 2024 | $5,450 | $512,996 | $99,198 | $413,798 |
| 2023 | $5,447 | $502,938 | $97,253 | $405,685 |
| 2022 | $5,342 | $493,078 | $95,347 | $397,731 |
| 2021 | $5,226 | $483,411 | $93,478 | $389,933 |
| 2020 | $4,966 | $478,455 | $92,520 | $385,935 |
| 2019 | $4,502 | $434,760 | $90,706 | $344,054 |
| 2018 | $4,422 | $426,236 | $88,928 | $337,308 |
| 2017 | $4,355 | $417,880 | $87,185 | $330,695 |
| 2016 | $4,187 | $409,687 | $85,476 | $324,211 |
| 2015 | $3,572 | $350,000 | $75,000 | $275,000 |
| 2014 | $3,321 | $325,000 | $75,000 | $250,000 |
Source: Public Records
Map
Nearby Homes
- 1805 Merrill Rd
- 6794 Rexdale Ln
- 6807 Rexdale Ln
- 6820 Leone Way
- 6541 Wheeler Rd
- 6674 Pentz Rd
- 6521 Wheeler Rd
- 6839 Pentz Rd
- 0 Summerwood Ct Unit PA25231363
- 6656 Pentz Rd Unit 23
- 6656 Pentz Rd Unit 29
- 6656 Pentz Rd Unit 19
- 6656 Pentz Rd
- 6656 Pentz Rd Unit 69
- 1945 Merrill Rd
- 6779 Matell Rd
- 1871 June Way
- 1668 Robin Place
- 6620 Pentz Rd
- 2015 Picnic Ln
- 1790 Merrill Rd
- 1790 Chris Ct
- 1798 Merrill Rd
- 1805 Chris Ct
- 1806 Merrill Rd
- 1796 Chris Ct
- 1766 Merrill Rd
- 1802 Chris Ct
- 1814 Merrill Rd
- 1797 Merrill Rd
- 6685 Nedry Dr
- 1758 Merrill Rd
- 1822 Merrill Rd
- 6793 Sylmar Ln
- 1750 Merrill Rd
- 6812 Leone Way
- 6790 Rexdale Ln
- 1826 Merrill Rd
- 6801 Sylmar Ln
- 6803 Leone Way