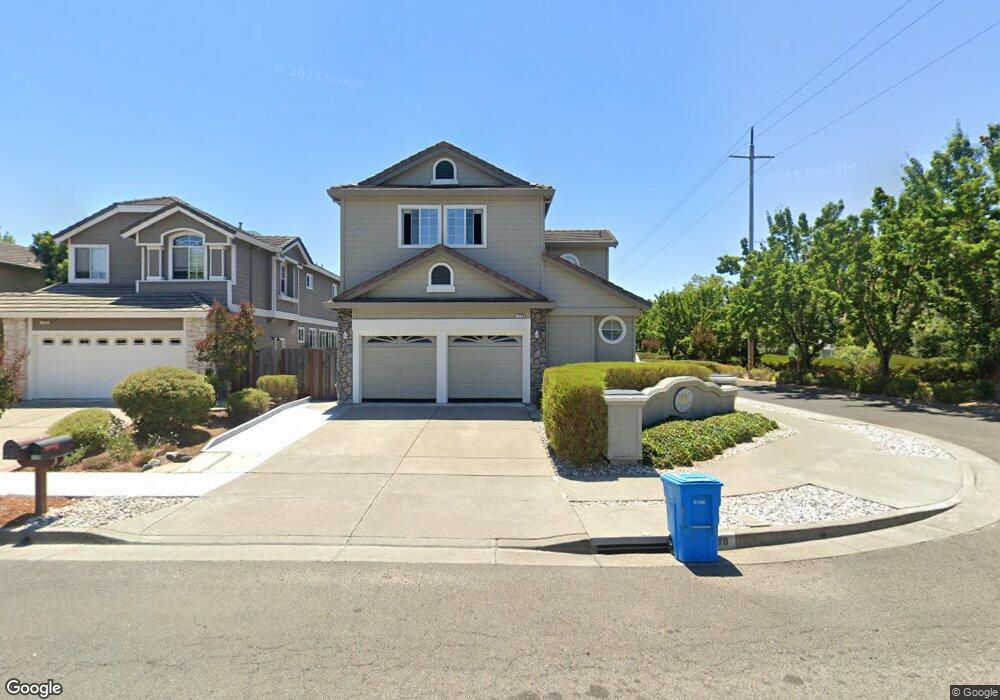
1799 Inverness Dr Petaluma, CA 94954
College Heights NeighborhoodEstimated Value: $709,091 - $889,000
3
Beds
2
Baths
1,354
Sq Ft
$569/Sq Ft
Est. Value
About This Home
This home is located at 1799 Inverness Dr, Petaluma, CA 94954 and is currently estimated at $770,773, approximately $569 per square foot. 1799 Inverness Dr is a home located in Sonoma County with nearby schools including Meadow Elementary School, Kenilworth Junior High School, and Casa Grande High School.
Ownership History
Date
Name
Owned For
Owner Type
Purchase Details
Closed on
Jun 17, 2022
Sold by
William Chelinim Stephen
Bought by
Stephen William Chelini And Theresa Ann Cheli
Current Estimated Value
Purchase Details
Closed on
Apr 7, 2004
Sold by
Chelini Steve William and Chelini Theresa Ann
Bought by
Chelini Steve William and Chelini Theresa Ann
Home Financials for this Owner
Home Financials are based on the most recent Mortgage that was taken out on this home.
Original Mortgage
$115,500
Interest Rate
5.57%
Mortgage Type
New Conventional
Purchase Details
Closed on
Oct 30, 1998
Sold by
Ann Chelini Stephen William and Ann Theresa
Bought by
Chelini Steve William and Chelini Theresa Ann
Home Financials for this Owner
Home Financials are based on the most recent Mortgage that was taken out on this home.
Original Mortgage
$150,500
Interest Rate
6.61%
Purchase Details
Closed on
Aug 31, 1992
Bought by
Chelini Steve William and Theresa Ann
Create a Home Valuation Report for This Property
The Home Valuation Report is an in-depth analysis detailing your home's value as well as a comparison with similar homes in the area
Home Values in the Area
Average Home Value in this Area
Purchase History
| Date | Buyer | Sale Price | Title Company |
|---|---|---|---|
| Stephen William Chelini And Theresa Ann Cheli | -- | Tillem Mcnichol & Brown | |
| Chelini Steve William | -- | -- | |
| Chelini Steve William | -- | First American Title | |
| Chelini Steve William | $207,000 | -- |
Source: Public Records
Mortgage History
| Date | Status | Borrower | Loan Amount |
|---|---|---|---|
| Previous Owner | Chelini Steve William | $115,500 | |
| Previous Owner | Chelini Steve William | $150,500 |
Source: Public Records
Tax History Compared to Growth
Tax History
| Year | Tax Paid | Tax Assessment Tax Assessment Total Assessment is a certain percentage of the fair market value that is determined by local assessors to be the total taxable value of land and additions on the property. | Land | Improvement |
|---|---|---|---|---|
| 2025 | $4,681 | $420,517 | $138,428 | $282,089 |
| 2024 | $4,681 | $412,272 | $135,714 | $276,558 |
| 2023 | $4,681 | $404,189 | $133,053 | $271,136 |
| 2022 | $4,591 | $396,265 | $130,445 | $265,820 |
| 2021 | $4,494 | $388,496 | $127,888 | $260,608 |
| 2020 | $4,524 | $384,513 | $126,577 | $257,936 |
| 2019 | $4,474 | $376,975 | $124,096 | $252,879 |
| 2018 | $4,489 | $369,584 | $121,663 | $247,921 |
| 2017 | $4,421 | $362,338 | $119,278 | $243,060 |
| 2016 | $4,289 | $355,235 | $116,940 | $238,295 |
| 2015 | $4,247 | $349,900 | $115,184 | $234,716 |
| 2014 | $4,208 | $343,047 | $112,928 | $230,119 |
Source: Public Records
Map
Nearby Homes
- 837 Vineyard Place
- 1757 Burgundy Ct
- 1548 Royal Oak Dr
- 1845 Sandstone Dr
- 1544 Crown Rd
- 1441 Woodside Cir
- 97 Candlewood Dr
- 1971 Lansdowne Way
- 1501 Florence Way
- 1407 Woodside Cir
- 116 Marvin Ct
- 529 Rosewood Cir
- 829 Winton Dr
- 71 Candlewood Dr
- 63 Oakwood Dr
- 628 Nikki Dr
- 523 Greenwich St
- 20 Oakwood Dr
- 717 N Mcdowell Blvd Unit 111
- 717 N Mcdowell Blvd Unit 511
- 1795 Inverness Dr
- 1791 Inverness Dr
- 703 Riesling Ct
- 707 Riesling Ct
- 826 Chardonnay Cir
- 828 Chardonnay Cir
- 824 Chardonnay Cir
- 711 Riesling Ct
- 822 Chardonnay Cir
- 1787 Inverness Dr
- 1798 Inverness Dr
- 820 Chardonnay Cir
- 1794 Inverness Dr
- 818 Chardonnay Cir
- 1790 Inverness Dr
- 816 Chardonnay Cir
- 1783 Inverness Dr
- 715 Riesling Ct
- 832 Chardonnay Cir
- 1786 Inverness Dr