Estimated Value: $257,000 - $344,000
Studio
2
Baths
1,792
Sq Ft
$166/Sq Ft
Est. Value
About This Home
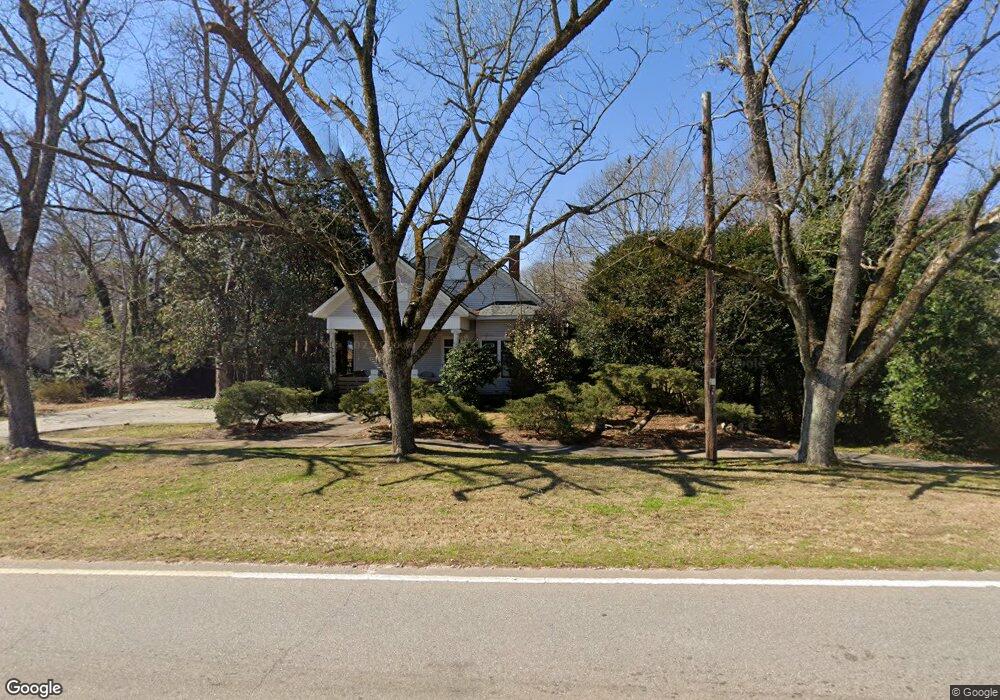
This home is located at 1799 Main St, Comer, GA 30629 and is currently estimated at $298,130, approximately $166 per square foot. 1799 Main St is a home located in Madison County with nearby schools including Madison County High School.
Ownership History
Date
Name
Owned For
Owner Type
Purchase Details
Closed on
Jun 28, 2024
Sold by
Mcguire Laura
Bought by
Nelson Laura
Current Estimated Value
Purchase Details
Closed on
May 31, 2016
Sold by
Strickland Stacey N
Bought by
Mcguire Larua
Home Financials for this Owner
Home Financials are based on the most recent Mortgage that was taken out on this home.
Original Mortgage
$93,600
Interest Rate
3.61%
Mortgage Type
New Conventional
Purchase Details
Closed on
Aug 4, 2010
Sold by
Mattern Leon J
Bought by
Strickland Stacey N
Home Financials for this Owner
Home Financials are based on the most recent Mortgage that was taken out on this home.
Original Mortgage
$31,200
Interest Rate
4.6%
Mortgage Type
Purchase Money Mortgage
Purchase Details
Closed on
Apr 9, 2002
Sold by
City Of Comer
Bought by
Strickland Stacey N
Purchase Details
Closed on
May 26, 1998
Sold by
Williams James R De
Bought by
Strickland Stacey N
Purchase Details
Closed on
Jan 1, 1994
Bought by
Williams James R De
Create a Home Valuation Report for This Property
The Home Valuation Report is an in-depth analysis detailing your home's value as well as a comparison with similar homes in the area
Purchase History
| Date | Buyer | Sale Price | Title Company |
|---|---|---|---|
| Nelson Laura | -- | -- | |
| Mcguire Larua | $117,000 | -- | |
| Strickland Stacey N | $48,000 | -- | |
| Strickland Stacey N | -- | -- | |
| Strickland Stacey N | $90,500 | -- | |
| Williams James R De | -- | -- |
Source: Public Records
Mortgage History
| Date | Status | Borrower | Loan Amount |
|---|---|---|---|
| Previous Owner | Mcguire Larua | $93,600 | |
| Previous Owner | Strickland Stacey N | $31,200 |
Source: Public Records
Tax History
| Year | Tax Paid | Tax Assessment Tax Assessment Total Assessment is a certain percentage of the fair market value that is determined by local assessors to be the total taxable value of land and additions on the property. | Land | Improvement |
|---|---|---|---|---|
| 2025 | $3,084 | $101,899 | $9,802 | $92,097 |
| 2024 | $3,084 | $98,923 | $9,802 | $89,121 |
| 2023 | $3,299 | $91,371 | $8,169 | $83,202 |
| 2022 | $2,520 | $78,784 | $5,614 | $73,170 |
| 2021 | $2,026 | $56,104 | $5,614 | $50,490 |
| 2020 | $1,784 | $55,287 | $4,797 | $50,490 |
| 2019 | $1,768 | $54,164 | $4,797 | $49,367 |
| 2018 | $1,709 | $52,187 | $4,389 | $47,798 |
| 2017 | $1,803 | $52,454 | $4,084 | $48,370 |
| 2016 | $1,043 | $36,599 | $3,713 | $32,886 |
| 2015 | $1,039 | $36,599 | $3,713 | $32,886 |
| 2014 | $1,086 | $38,123 | $5,047 | $33,076 |
| 2013 | -- | $38,123 | $5,047 | $33,076 |
Source: Public Records
Map
Nearby Homes
- 48 E Georgia Ave
- 125 Laurel Ave
- 77 Laurel Ave
- 12 Laurel Ave
- 540 Sunset Ave
- 113 Sidetrack Cir
- 640 Gholston St
- 2633 Paoli St Unit TRACT 1
- 2665 Paoli St Unit TRACT 3
- 921 Highway 72 E
- 1360 Hill St
- 199 Brickyard Rd
- 10 Shannons Ln
- 116 Scarlett Oak Ln
- 52 Willow Oak Cir
- 0 Lowe Rd Unit 10614126
- 15 Shady Oaks Ln
- 2975 Georgia 72
- 0 Paoli Rd Unit 23882833
- 760 Fortson Compton Rd
Your Personal Tour Guide
Ask me questions while you tour the home.