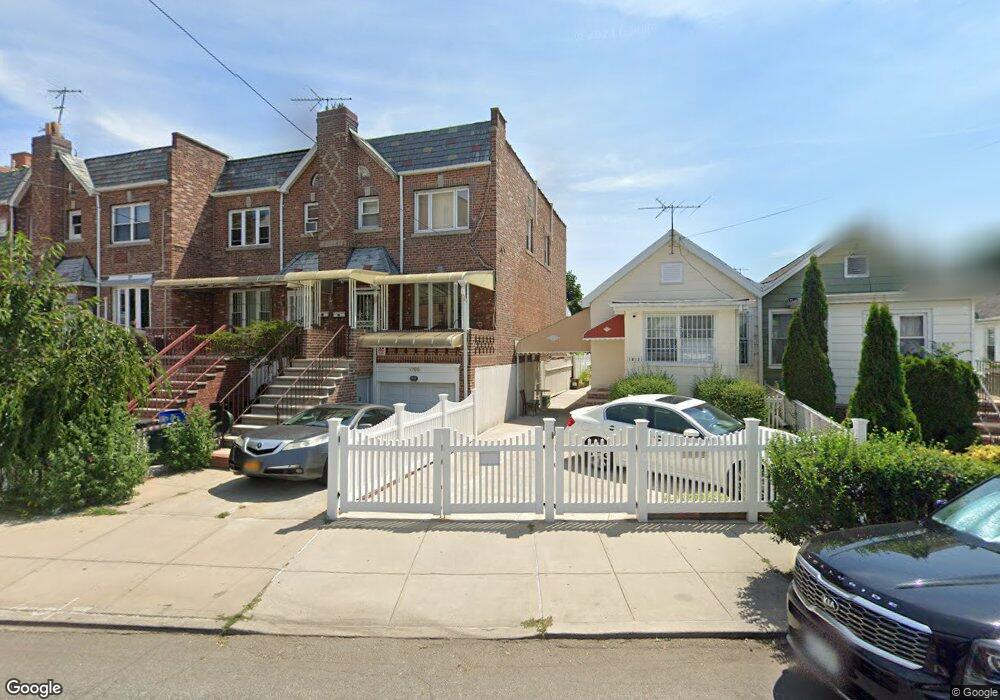
1799 W 3rd St Brooklyn, NY 11223
Gravesend NeighborhoodEstimated Value: $1,243,000 - $1,321,000
Studio
--
Bath
2,011
Sq Ft
$639/Sq Ft
Est. Value
About This Home
This home is located at 1799 W 3rd St, Brooklyn, NY 11223 and is currently estimated at $1,285,812, approximately $639 per square foot. 1799 W 3rd St is a home located in Kings County with nearby schools including P.S. 215 Morris H Weiss, Is 228 David A Boody, and Coney Island Preparatory Public Charter School.
Ownership History
Date
Name
Owned For
Owner Type
Purchase Details
Closed on
Oct 13, 2023
Sold by
Liang Mei Xiao and Ma Cuong Duc
Bought by
Claudia Ma As Trustee and Cuong Duc Ma
Current Estimated Value
Purchase Details
Closed on
Mar 13, 2007
Sold by
Basenkis Emma and Basenkis Semen
Bought by
Duc Ma Cuong and Xiao Liang Mei
Home Financials for this Owner
Home Financials are based on the most recent Mortgage that was taken out on this home.
Original Mortgage
$400,000
Interest Rate
6.33%
Mortgage Type
Purchase Money Mortgage
Purchase Details
Closed on
Nov 25, 1998
Sold by
Vogel Simpson
Bought by
Basenkis Semen and Basenkis Emma
Home Financials for this Owner
Home Financials are based on the most recent Mortgage that was taken out on this home.
Original Mortgage
$189,000
Interest Rate
6.85%
Mortgage Type
Purchase Money Mortgage
Create a Home Valuation Report for This Property
The Home Valuation Report is an in-depth analysis detailing your home's value as well as a comparison with similar homes in the area
Home Values in the Area
Average Home Value in this Area
Purchase History
| Date | Buyer | Sale Price | Title Company |
|---|---|---|---|
| Claudia Ma As Trustee | -- | -- | |
| Claudia Ma As Trustee | -- | -- | |
| Duc Ma Cuong | $600,000 | -- | |
| Duc Ma Cuong | $600,000 | -- | |
| Basenkis Semen | $210,000 | Commonwealth Land Title Ins | |
| Basenkis Semen | $210,000 | Commonwealth Land Title Ins |
Source: Public Records
Mortgage History
| Date | Status | Borrower | Loan Amount |
|---|---|---|---|
| Previous Owner | Duc Ma Cuong | $400,000 | |
| Previous Owner | Basenkis Semen | $189,000 |
Source: Public Records
Tax History
| Year | Tax Paid | Tax Assessment Tax Assessment Total Assessment is a certain percentage of the fair market value that is determined by local assessors to be the total taxable value of land and additions on the property. | Land | Improvement |
|---|---|---|---|---|
| 2025 | $8,355 | $86,460 | $12,720 | $73,740 |
| 2024 | $8,355 | $75,300 | $12,720 | $62,580 |
| 2023 | $8,011 | $66,300 | $12,720 | $53,580 |
| 2022 | $7,438 | $69,660 | $12,720 | $56,940 |
| 2021 | $7,696 | $66,780 | $12,720 | $54,060 |
| 2020 | $3,846 | $55,500 | $12,720 | $42,780 |
| 2019 | $7,202 | $55,500 | $12,720 | $42,780 |
| 2018 | $6,641 | $34,038 | $8,580 | $25,458 |
| 2017 | $6,274 | $32,246 | $7,296 | $24,950 |
| 2016 | $6,017 | $31,648 | $8,006 | $23,642 |
| 2015 | $3,449 | $31,648 | $11,098 | $20,550 |
| 2014 | $3,449 | $29,859 | $11,609 | $18,250 |
Source: Public Records
Map
Nearby Homes
- 33 Kings Place
- 204 Highlawn Ave
- 332 Kings Hwy
- 1858 W 5th St
- 15 Van Sicklen St
- 314 Kings Hwy
- 1864 W 6th St
- 172 Highlawn Ave
- 1880 W 6th St
- 1888 W 6th St
- 290 Kings Hwy
- 1684 W 2nd St
- 1854 W 7th St
- 284 Kings Hwy
- 1801 W 8th St
- 174 Avenue S
- 1683 W 7th St Unit 2B
- 1683 W 7th St Unit 3A
- 1683 W 7th St Unit 3B
- 1683 W 7th St Unit 4B
Your Personal Tour Guide
Ask me questions while you tour the home.