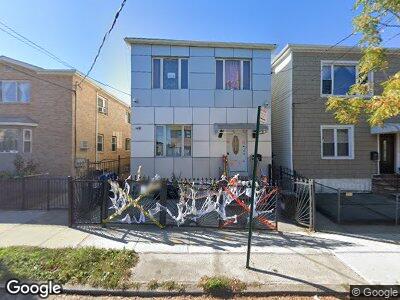
18-32 126th St College Point, NY 11356
College Point NeighborhoodEstimated Value: $961,154 - $1,290,000
7
Beds
3
Baths
2,520
Sq Ft
$454/Sq Ft
Est. Value
About This Home
This home is located at 18-32 126th St, College Point, NY 11356 and is currently estimated at $1,145,289, approximately $454 per square foot. 18-32 126th St is a home located in Queens County with nearby schools including P.S. 29, Jhs 185 Edward Bleeker, and Flushing High School.
Ownership History
Date
Name
Owned For
Owner Type
Purchase Details
Closed on
Feb 26, 2015
Sold by
Diaz Sandra and Sanchez Franklin
Bought by
Chen Jin Ying and Jiang Nai Qi
Current Estimated Value
Home Financials for this Owner
Home Financials are based on the most recent Mortgage that was taken out on this home.
Original Mortgage
$387,500
Outstanding Balance
$305,213
Interest Rate
3.75%
Mortgage Type
New Conventional
Estimated Equity
$833,683
Purchase Details
Closed on
Sep 5, 2008
Sold by
Doll Josephine
Bought by
Ruan Jin Long and Wen Er Mei
Home Financials for this Owner
Home Financials are based on the most recent Mortgage that was taken out on this home.
Original Mortgage
$100,000
Interest Rate
6.54%
Mortgage Type
Purchase Money Mortgage
Purchase Details
Closed on
Jan 31, 2002
Sold by
Wieber Miriam
Bought by
Sanchez Franklin and Diaz Sandra
Home Financials for this Owner
Home Financials are based on the most recent Mortgage that was taken out on this home.
Original Mortgage
$318,250
Interest Rate
7.01%
Create a Home Valuation Report for This Property
The Home Valuation Report is an in-depth analysis detailing your home's value as well as a comparison with similar homes in the area
Home Values in the Area
Average Home Value in this Area
Purchase History
| Date | Buyer | Sale Price | Title Company |
|---|---|---|---|
| Chen Jin Ying | $775,000 | -- | |
| Ruan Jin Long | $365,000 | -- | |
| Sanchez Franklin | -- | -- |
Source: Public Records
Mortgage History
| Date | Status | Borrower | Loan Amount |
|---|---|---|---|
| Open | Chen Jin Ying | $387,500 | |
| Previous Owner | Diaz Sandra | $375,500 | |
| Previous Owner | Ruan Jin Long | $100,000 | |
| Previous Owner | Diaz Sandra | $84,000 | |
| Previous Owner | Sanchez Franklin | $318,250 | |
| Previous Owner | Wieber Miriam | $55,582 | |
| Previous Owner | Wieber Miriam | $55,000 | |
| Previous Owner | Wieber Miriam | $20,000 |
Source: Public Records
Tax History Compared to Growth
Tax History
| Year | Tax Paid | Tax Assessment Tax Assessment Total Assessment is a certain percentage of the fair market value that is determined by local assessors to be the total taxable value of land and additions on the property. | Land | Improvement |
|---|---|---|---|---|
| 2024 | $7,243 | $37,404 | $5,401 | $32,003 |
| 2023 | $6,886 | $35,686 | $4,711 | $30,975 |
| 2022 | $6,494 | $70,440 | $10,440 | $60,000 |
| 2021 | $6,852 | $58,380 | $10,440 | $47,940 |
| 2020 | $6,694 | $64,140 | $10,440 | $53,700 |
| 2019 | $6,228 | $68,820 | $10,440 | $58,380 |
| 2018 | $5,764 | $29,738 | $5,600 | $24,138 |
| 2017 | $5,470 | $28,305 | $5,991 | $22,314 |
| 2016 | $5,349 | $28,305 | $5,991 | $22,314 |
| 2015 | $3,001 | $27,519 | $8,525 | $18,994 |
| 2014 | $3,001 | $25,975 | $8,468 | $17,507 |
Source: Public Records
Map
Nearby Homes
- 125-10 18th Ave
- 124-17 18th Ave
- 18-31 124th St
- 1517 125th St
- 18-43 124th St
- 15-09 127th St
- 20-44 127th St
- 14-16 128th St
- 22-01 125th St
- 125-19 14th Ave
- 22-03 125th St
- 125-18 22nd Ave
- 2105 123rd St
- 18-24 College Point Blvd
- 18-35/39 College Point Blvd
- 20-11 College Point Blvd
- 13-25 126th St
- 20-22 College Point Blvd
- 1446 College Point Blvd
- 120-17 18th Ave
- 18-32 126th St
- 1814 126th St Unit 2Fl
- 1814 126th St Unit 1Fl.
- 1814 126th St
- 1814 126th St
- 1814 126th St Unit 1st fl
- 1814 126th St Unit 1Fl.
- 1814 126th St
- 1818 126th St
- 1812 126th St
- 1820 126th St
- 18-22 126th St
- 1822 126th St
- 18-18 126th St Unit 2
- 18-18 126th St Unit 1
- 18-18 126th St
- 18-24 126th St
- 1824 126th St
- 12518 18th Ave
- 12520 18th Ave