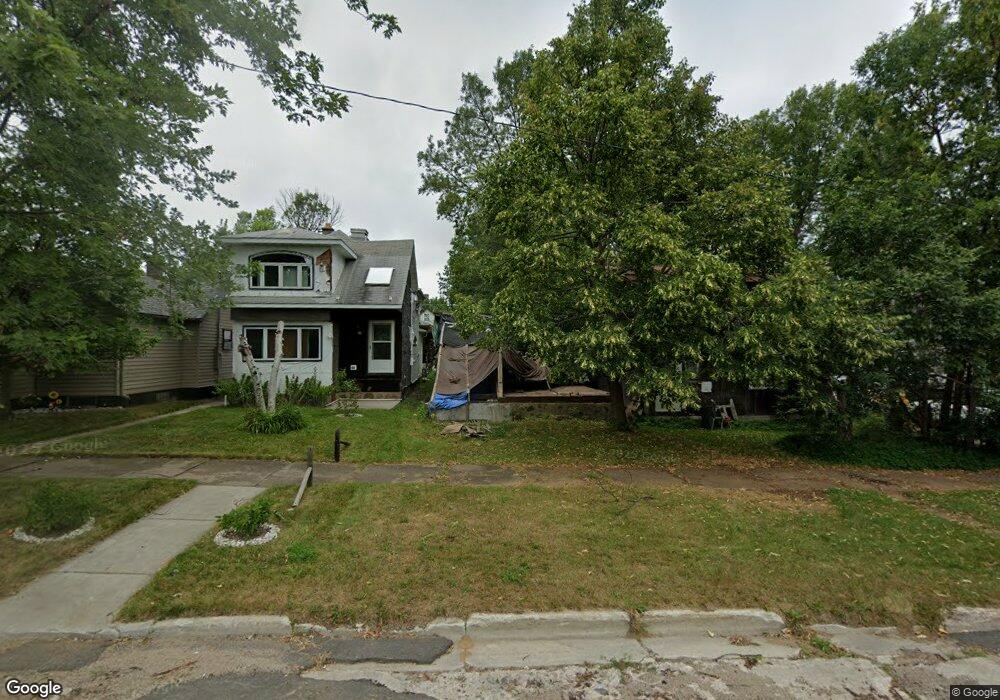
18 3rd St SE Chisholm, MN 55719
Estimated Value: $92,000 - $137,000
4
Beds
1
Bath
1,110
Sq Ft
$99/Sq Ft
Est. Value
About This Home
This home is located at 18 3rd St SE, Chisholm, MN 55719 and is currently estimated at $110,037, approximately $99 per square foot. 18 3rd St SE is a home located in St. Louis County with nearby schools including Vaughan Elementary School, Chisholm Elementary School, and Chisholm Secondary School.
Ownership History
Date
Name
Owned For
Owner Type
Purchase Details
Closed on
Sep 19, 2006
Sold by
North Shore Fcu
Bought by
Mclaughlin John W
Current Estimated Value
Purchase Details
Closed on
Sep 16, 2002
Sold by
Gorsuch Doreen
Bought by
Thompson Charles V
Purchase Details
Closed on
Apr 16, 2002
Sold by
Rootness Catherine L
Bought by
Thompson Charles and Gorsuch Doreen
Home Financials for this Owner
Home Financials are based on the most recent Mortgage that was taken out on this home.
Original Mortgage
$18,500
Interest Rate
6.95%
Create a Home Valuation Report for This Property
The Home Valuation Report is an in-depth analysis detailing your home's value as well as a comparison with similar homes in the area
Home Values in the Area
Average Home Value in this Area
Purchase History
| Date | Buyer | Sale Price | Title Company |
|---|---|---|---|
| Mclaughlin John W | $11,000 | All American Title Company | |
| Thompson Charles V | -- | -- | |
| Thompson Charles | $15,000 | -- |
Source: Public Records
Mortgage History
| Date | Status | Borrower | Loan Amount |
|---|---|---|---|
| Previous Owner | Thompson Charles | $18,500 |
Source: Public Records
Tax History Compared to Growth
Tax History
| Year | Tax Paid | Tax Assessment Tax Assessment Total Assessment is a certain percentage of the fair market value that is determined by local assessors to be the total taxable value of land and additions on the property. | Land | Improvement |
|---|---|---|---|---|
| 2024 | $218 | $11,300 | $3,700 | $7,600 |
| 2023 | $218 | $12,400 | $3,900 | $8,500 |
| 2022 | $24 | $14,600 | $3,300 | $11,300 |
| 2021 | $34 | $9,200 | $2,000 | $7,200 |
| 2020 | $34 | $12,200 | $2,000 | $10,200 |
| 2019 | $34 | $12,200 | $2,000 | $10,200 |
| 2018 | $12 | $12,200 | $2,000 | $10,200 |
| 2017 | $12 | $19,400 | $2,000 | $17,400 |
| 2016 | $12 | $18,200 | $2,500 | $15,700 |
| 2015 | $6 | $2,600 | $400 | $2,200 |
| 2014 | $6 | $400 | $100 | $300 |
Source: Public Records
Map
Nearby Homes