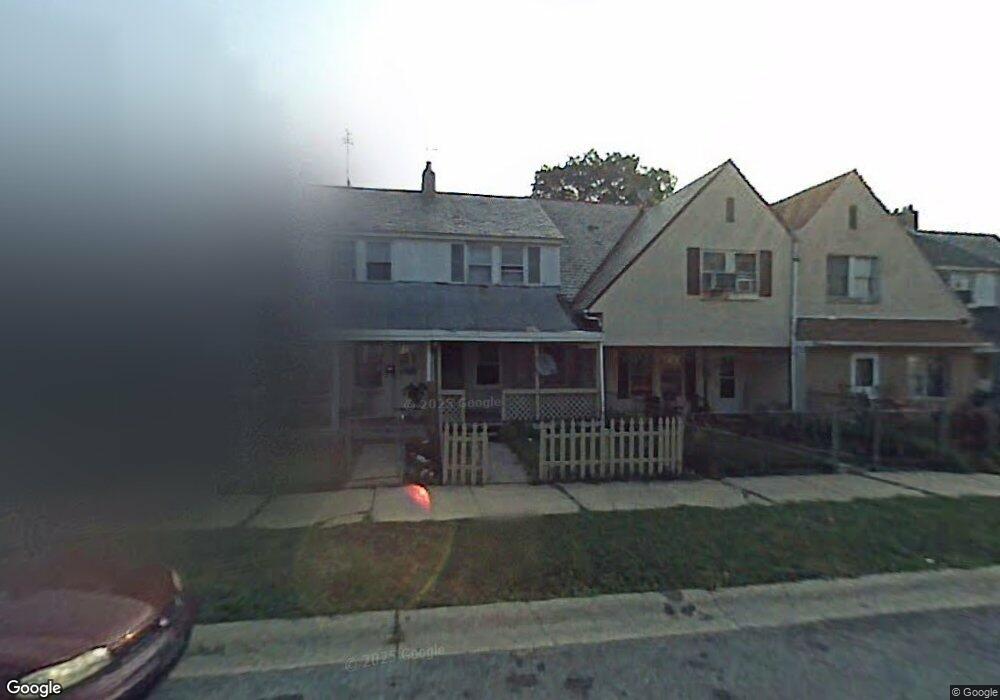
18 4th Ave Claymont, DE 19703
Estimated Value: $137,000 - $219,000
3
Beds
1
Bath
663
Sq Ft
$276/Sq Ft
Est. Value
About This Home
This home is located at 18 4th Ave, Claymont, DE 19703 and is currently estimated at $183,013, approximately $276 per square foot. 18 4th Ave is a home located in New Castle County with nearby schools including Claymont Elementary School, Talley Middle School, and Brandywine High School.
Ownership History
Date
Name
Owned For
Owner Type
Purchase Details
Closed on
Mar 30, 2006
Sold by
Jjjk Enterprises Llc
Bought by
Antioch Property Management Llc
Current Estimated Value
Home Financials for this Owner
Home Financials are based on the most recent Mortgage that was taken out on this home.
Original Mortgage
$255,000
Outstanding Balance
$145,862
Interest Rate
6.28%
Mortgage Type
Purchase Money Mortgage
Estimated Equity
$37,151
Create a Home Valuation Report for This Property
The Home Valuation Report is an in-depth analysis detailing your home's value as well as a comparison with similar homes in the area
Home Values in the Area
Average Home Value in this Area
Purchase History
| Date | Buyer | Sale Price | Title Company |
|---|---|---|---|
| Antioch Property Management Llc | -- | None Available | |
| Jjjk Enterprises Llc | -- | None Available | |
| Feeley Joseph J | -- | None Available |
Source: Public Records
Mortgage History
| Date | Status | Borrower | Loan Amount |
|---|---|---|---|
| Open | Jjjk Enterprises Llc | $255,000 | |
| Closed | Antioch Property Management Llc | $255,000 |
Source: Public Records
Tax History
| Year | Tax Paid | Tax Assessment Tax Assessment Total Assessment is a certain percentage of the fair market value that is determined by local assessors to be the total taxable value of land and additions on the property. | Land | Improvement |
|---|---|---|---|---|
| 2024 | $840 | $22,000 | $6,900 | $15,100 |
| 2023 | $767 | $22,000 | $6,900 | $15,100 |
| 2022 | $780 | $22,000 | $6,900 | $15,100 |
| 2021 | $780 | $22,000 | $6,900 | $15,100 |
| 2020 | $2,031 | $22,000 | $6,900 | $15,100 |
| 2019 | $1,037 | $22,000 | $6,900 | $15,100 |
| 2018 | $747 | $22,000 | $6,900 | $15,100 |
| 2017 | $735 | $22,000 | $6,900 | $15,100 |
| 2016 | $734 | $22,000 | $6,900 | $15,100 |
| 2015 | $676 | $22,000 | $6,900 | $15,100 |
| 2014 | $975 | $22,000 | $6,900 | $15,100 |
Source: Public Records
Map
Nearby Homes
- 3047 4th Ave
- 3037 W Court Ave
- 8 Commonwealth Ave
- 2810 Green St
- 4 Forrest Ave
- 52 Lawson Ave
- 50 Lawson Ave
- 2 Franklin Ave
- 1237 Parish Ave
- 139 Honeywell Dr
- 7 Hillside Rd
- 1134 Clemson St
- 905 Harvey Rd
- 2520 Reynolds Ave
- 453 Lenape Way
- 14 Ruby Dr
- 120 Hilldale Ct
- 1 Marion Ave
- 8 Garrett Rd
- 305 W Delaware Ave
Your Personal Tour Guide
Ask me questions while you tour the home.