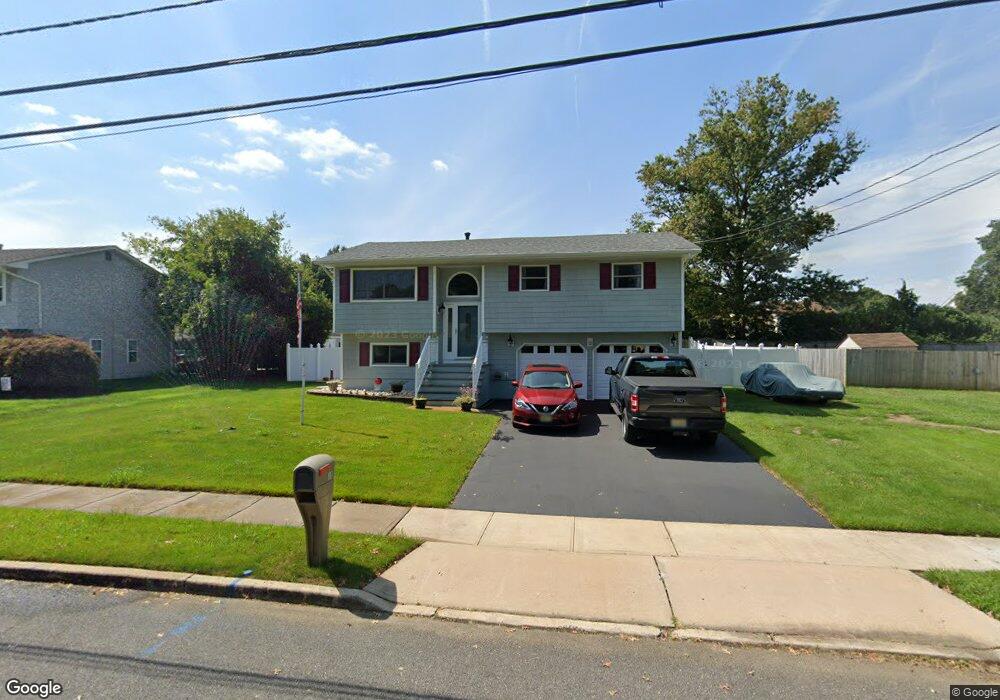
18 Allen Dr Allentown, NJ 08501
Estimated Value: $478,000 - $565,000
3
Beds
2
Baths
1,486
Sq Ft
$351/Sq Ft
Est. Value
About This Home
This home is located at 18 Allen Dr, Allentown, NJ 08501 and is currently estimated at $521,143, approximately $350 per square foot. 18 Allen Dr is a home located in Monmouth County with nearby schools including Newell Elementary School, Stonebridge Middle School, and Allentown High School.
Ownership History
Date
Name
Owned For
Owner Type
Purchase Details
Closed on
Mar 29, 2007
Sold by
Riebe Jeffrey
Bought by
Bolvin Roland L and Bolvin Joan
Current Estimated Value
Home Financials for this Owner
Home Financials are based on the most recent Mortgage that was taken out on this home.
Original Mortgage
$308,357
Interest Rate
6.25%
Mortgage Type
FHA
Purchase Details
Closed on
Nov 30, 2004
Sold by
Gulliford Kenneth
Bought by
Riebe Jeffrey and Riebe Nancy
Home Financials for this Owner
Home Financials are based on the most recent Mortgage that was taken out on this home.
Original Mortgage
$255,000
Interest Rate
5.74%
Create a Home Valuation Report for This Property
The Home Valuation Report is an in-depth analysis detailing your home's value as well as a comparison with similar homes in the area
Home Values in the Area
Average Home Value in this Area
Purchase History
| Date | Buyer | Sale Price | Title Company |
|---|---|---|---|
| Bolvin Roland L | $279,000 | -- | |
| Riebe Jeffrey | $285,000 | -- |
Source: Public Records
Mortgage History
| Date | Status | Borrower | Loan Amount |
|---|---|---|---|
| Previous Owner | Bolvin Roland L | $308,357 | |
| Previous Owner | Riebe Jeffrey | $255,000 |
Source: Public Records
Tax History Compared to Growth
Tax History
| Year | Tax Paid | Tax Assessment Tax Assessment Total Assessment is a certain percentage of the fair market value that is determined by local assessors to be the total taxable value of land and additions on the property. | Land | Improvement |
|---|---|---|---|---|
| 2025 | $7,398 | $229,900 | $135,500 | $94,400 |
| 2024 | $6,617 | $229,900 | $135,500 | $94,400 |
| 2023 | $6,617 | $229,900 | $135,500 | $94,400 |
| 2022 | $6,106 | $229,900 | $135,500 | $94,400 |
| 2021 | $6,106 | $229,900 | $135,500 | $94,400 |
| 2020 | $6,784 | $229,900 | $135,500 | $94,400 |
| 2019 | $6,964 | $229,900 | $135,500 | $94,400 |
| 2018 | $7,003 | $229,900 | $135,500 | $94,400 |
| 2017 | $7,007 | $229,900 | $135,500 | $94,400 |
| 2016 | $6,994 | $229,900 | $135,500 | $94,400 |
| 2015 | $6,258 | $229,900 | $135,500 | $94,400 |
| 2014 | $5,224 | $195,000 | $100,600 | $94,400 |
Source: Public Records
Map
Nearby Homes