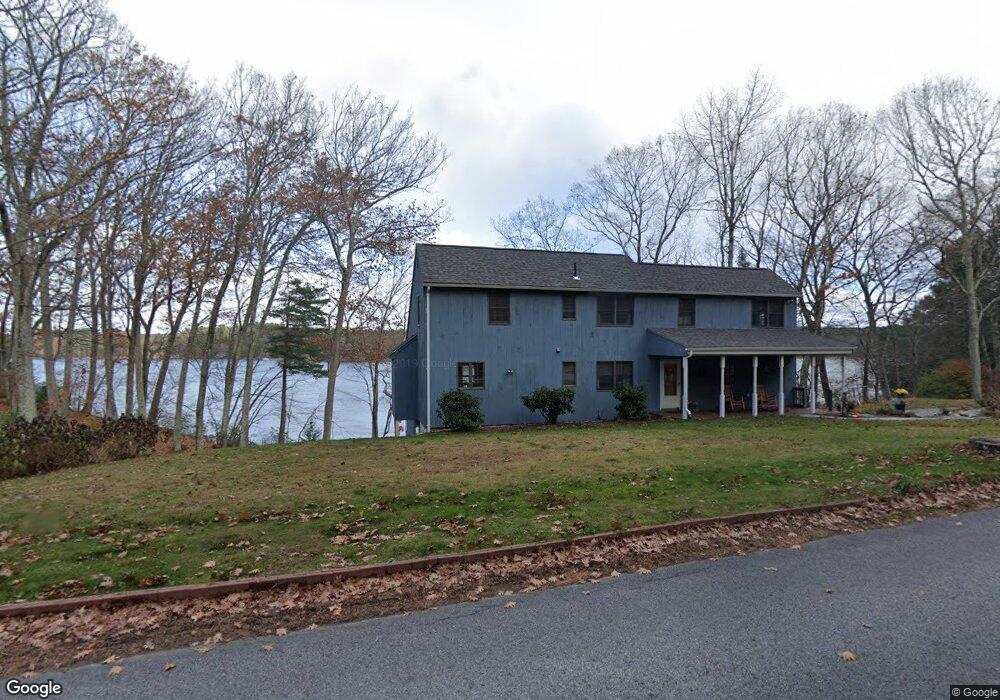
18 Allen Rd Brookfield, MA 01506
Estimated Value: $476,176 - $574,000
3
Beds
2
Baths
1,512
Sq Ft
$346/Sq Ft
Est. Value
About This Home
This home is located at 18 Allen Rd, Brookfield, MA 01506 and is currently estimated at $523,044, approximately $345 per square foot. 18 Allen Rd is a home located in Worcester County with nearby schools including Brookfield Elementary School, Tantasqua Regional Junior High School, and Tantasqua Regional High School.
Ownership History
Date
Name
Owned For
Owner Type
Purchase Details
Closed on
Oct 19, 2022
Sold by
Giller Gary P
Bought by
Giller Ft 2022 and Giller
Current Estimated Value
Purchase Details
Closed on
Jul 8, 2015
Sold by
Gillis Jaeger Fam Ptns
Bought by
Taft Donald R and Knight Mary L
Purchase Details
Closed on
Feb 23, 2010
Sold by
Molloy Ann K and Giller Alfred T
Bought by
Giller Gary P
Purchase Details
Closed on
Jun 28, 1982
Bought by
Giller Gary P
Create a Home Valuation Report for This Property
The Home Valuation Report is an in-depth analysis detailing your home's value as well as a comparison with similar homes in the area
Home Values in the Area
Average Home Value in this Area
Purchase History
| Date | Buyer | Sale Price | Title Company |
|---|---|---|---|
| Giller Ft 2022 | -- | None Available | |
| Giller Ft 2022 | -- | None Available | |
| Taft Donald R | $70,000 | -- | |
| Taft Donald R | $70,000 | -- | |
| Giller Gary P | -- | -- | |
| Giller Gary P | -- | -- | |
| Giller Gary P | $97,000 | -- |
Source: Public Records
Mortgage History
| Date | Status | Borrower | Loan Amount |
|---|---|---|---|
| Previous Owner | Giller Gary P | $117,000 | |
| Previous Owner | Giller Gary P | $85,000 | |
| Previous Owner | Giller Gary P | $40,000 |
Source: Public Records
Tax History
| Year | Tax Paid | Tax Assessment Tax Assessment Total Assessment is a certain percentage of the fair market value that is determined by local assessors to be the total taxable value of land and additions on the property. | Land | Improvement |
|---|---|---|---|---|
| 2025 | $6,692 | $432,300 | $221,200 | $211,100 |
| 2024 | $6,571 | $432,300 | $221,200 | $211,100 |
| 2023 | $6,374 | $398,900 | $214,800 | $184,100 |
| 2022 | $6,100 | $371,300 | $204,500 | $166,800 |
| 2021 | $6,136 | $341,100 | $203,600 | $137,500 |
| 2018 | $6,322 | $330,300 | $193,900 | $136,400 |
| 2017 | $6,214 | $316,700 | $194,500 | $122,200 |
| 2015 | $6,065 | $316,700 | $194,500 | $122,200 |
| 2014 | $5,922 | $316,700 | $194,500 | $122,200 |
Source: Public Records
Map
Nearby Homes
Your Personal Tour Guide
Ask me questions while you tour the home.