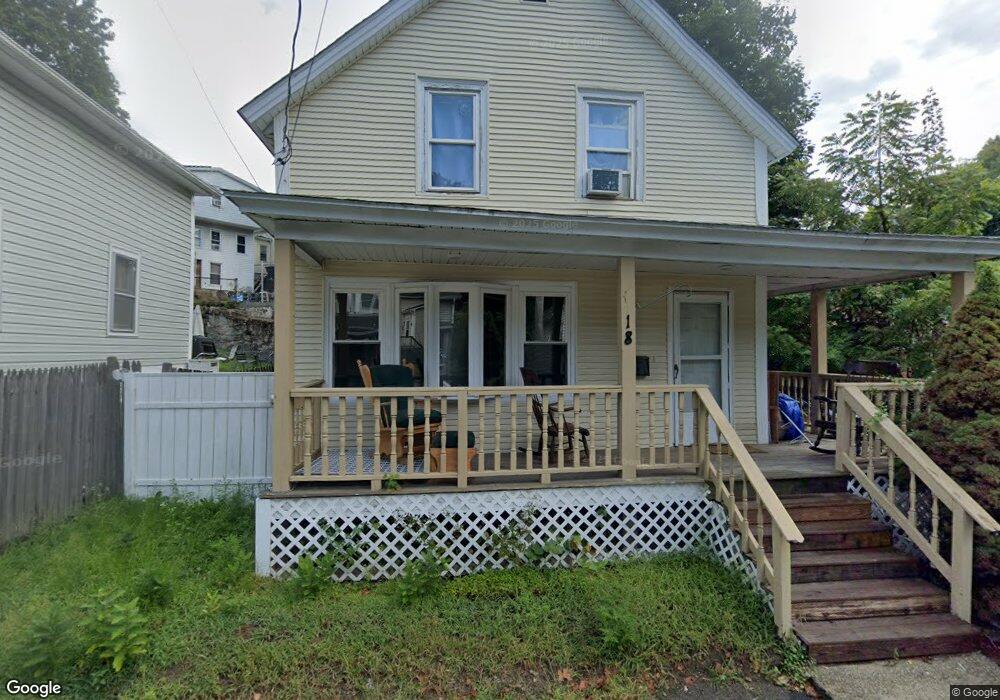
18 Baker St West Warwick, RI 02893
West Warwick Centre NeighborhoodEstimated Value: $258,000 - $362,000
3
Beds
1
Bath
1,131
Sq Ft
$282/Sq Ft
Est. Value
About This Home
This home is located at 18 Baker St, West Warwick, RI 02893 and is currently estimated at $318,659, approximately $281 per square foot. 18 Baker St is a home located in Kent County with nearby schools including West Warwick High School.
Ownership History
Date
Name
Owned For
Owner Type
Purchase Details
Closed on
Jun 25, 2024
Sold by
Garcia Alberto A and Pujols Tehani R
Bought by
Pujols Tehani and Pujols Yoirys
Current Estimated Value
Home Financials for this Owner
Home Financials are based on the most recent Mortgage that was taken out on this home.
Original Mortgage
$244,847
Outstanding Balance
$241,482
Interest Rate
6.25%
Mortgage Type
FHA
Estimated Equity
$77,177
Purchase Details
Closed on
Jun 13, 2016
Sold by
Rigp Phoenix Thompson
Bought by
Rigp Phoenix Thompson
Purchase Details
Closed on
Jan 26, 2016
Sold by
Kaja Hld 2 Llc
Bought by
Garcia Alberto A and Pujols Tehani R
Purchase Details
Closed on
Jun 26, 2015
Sold by
Us Bank Na Tr
Bought by
Kaja Holdings 2 Llc
Purchase Details
Closed on
Aug 21, 2014
Sold by
Parker Steven E
Bought by
Us Bank Na
Purchase Details
Closed on
Aug 22, 2012
Sold by
Aj Props Llc
Bought by
Parker Steven E and Parker Julie A
Purchase Details
Closed on
Sep 13, 1996
Sold by
Anglin Lenoy C and Anglin Virginia
Bought by
Parker Steven E
Create a Home Valuation Report for This Property
The Home Valuation Report is an in-depth analysis detailing your home's value as well as a comparison with similar homes in the area
Home Values in the Area
Average Home Value in this Area
Purchase History
| Date | Buyer | Sale Price | Title Company |
|---|---|---|---|
| Pujols Tehani | -- | None Available | |
| Pujols Tehani | -- | None Available | |
| Rigp Phoenix Thompson | $5,196 | -- | |
| Garcia Alberto A | $15,000 | -- | |
| Kaja Holdings 2 Llc | $8,050 | -- | |
| Us Bank Na | $81,000 | -- | |
| Parker Steven E | $1,506 | -- | |
| Parker Steven E | $50,000 | -- | |
| Phoenix Thompson Rigp | $5,196 | -- | |
| Garcia Alberto A | $15,000 | -- | |
| Kaja Holdings 2 Llc | $8,050 | -- | |
| Us Bank Na | $81,000 | -- | |
| Parker Steven E | $1,506 | -- | |
| Parker Steven E | $50,000 | -- |
Source: Public Records
Mortgage History
| Date | Status | Borrower | Loan Amount |
|---|---|---|---|
| Open | Pujols Tehani | $244,847 | |
| Closed | Pujols Tehani | $244,847 | |
| Previous Owner | Parker Steven E | $164,000 | |
| Previous Owner | Parker Steven E | $150,000 |
Source: Public Records
Tax History Compared to Growth
Tax History
| Year | Tax Paid | Tax Assessment Tax Assessment Total Assessment is a certain percentage of the fair market value that is determined by local assessors to be the total taxable value of land and additions on the property. | Land | Improvement |
|---|---|---|---|---|
| 2025 | $3,640 | $254,700 | $67,600 | $187,100 |
| 2024 | $3,749 | $200,600 | $43,000 | $157,600 |
| 2023 | $3,675 | $200,600 | $43,000 | $157,600 |
| 2022 | $3,619 | $200,600 | $43,000 | $157,600 |
| 2021 | $1,806 | $78,500 | $35,300 | $43,200 |
| 2020 | $1,806 | $78,500 | $35,300 | $43,200 |
| 2019 | $2,302 | $78,500 | $35,300 | $43,200 |
| 2018 | $1,912 | $72,400 | $33,100 | $39,300 |
| 2017 | $1,905 | $72,400 | $33,100 | $39,300 |
| 2016 | $1,871 | $72,400 | $33,100 | $39,300 |
| 2015 | $2,318 | $89,300 | $33,100 | $56,200 |
| 2014 | -- | $89,300 | $33,100 | $56,200 |
Source: Public Records
Map
Nearby Homes